iFANN
    iFANN ๊ฒ€์ƒ‰...
    ๋กœ๊ทธ์ธ
    ํ™ˆ
    ๋‰ด์Šค
    ๋™์˜์ƒ
    ๋ถ
    ์‚ฌ์ง„
    GIF
    ํƒ์ƒ‰
    ํˆฌํ‘œ
    ์–ด์›Œ๋“œ
    iFAMOUS
    ์œ„ํ‚ค
    ์• ๋‹ˆ
    ๋ฃธ
    ์•Œ๋ฆผ
    ๋ฉ”์‹œ์ง€
    ๋ถ๋งˆํฌ
    ํ”„๋กœํ•„
    ์œ„ํ‚ค์–ด์›Œ๋“œiFAMOUS๋žญํ‚น์‚ฐ์—…ํฌ๋ฆฌ์—์ดํ„ฐ ๋ฆฌ์›Œ๋“œ์‚ฌ์šฉ์ž ๋ฆฌ์›Œ๋“œ์•ฝ๊ด€๊ฐœ์ธ์ •๋ณด์ปค๋ฎค๋‹ˆํ‹ฐ ๊ฐ€์ด๋“œ๋ผ์ธ๊ฒŒ์‹œ ์ค‘๋‹จ / DMCA๋„์›€๋ง๊ฐœ๋ฐœ์ž

    ยฉ 2026 iFANN

    ํ™ˆ
    ๊ฒ€์ƒ‰
    ๋ฉ”์‹œ์ง€
    ์•Œ๋ฆผ
    ํ”„๋กœํ•„
    ์‚ฌ์ง„
    ๐Ÿ† Jakob Eras
    ๐Ÿ† Jakob Eras@Jakob.eras3mo
    ๐Ÿ’ญStock Market๐Ÿ’ญFinance
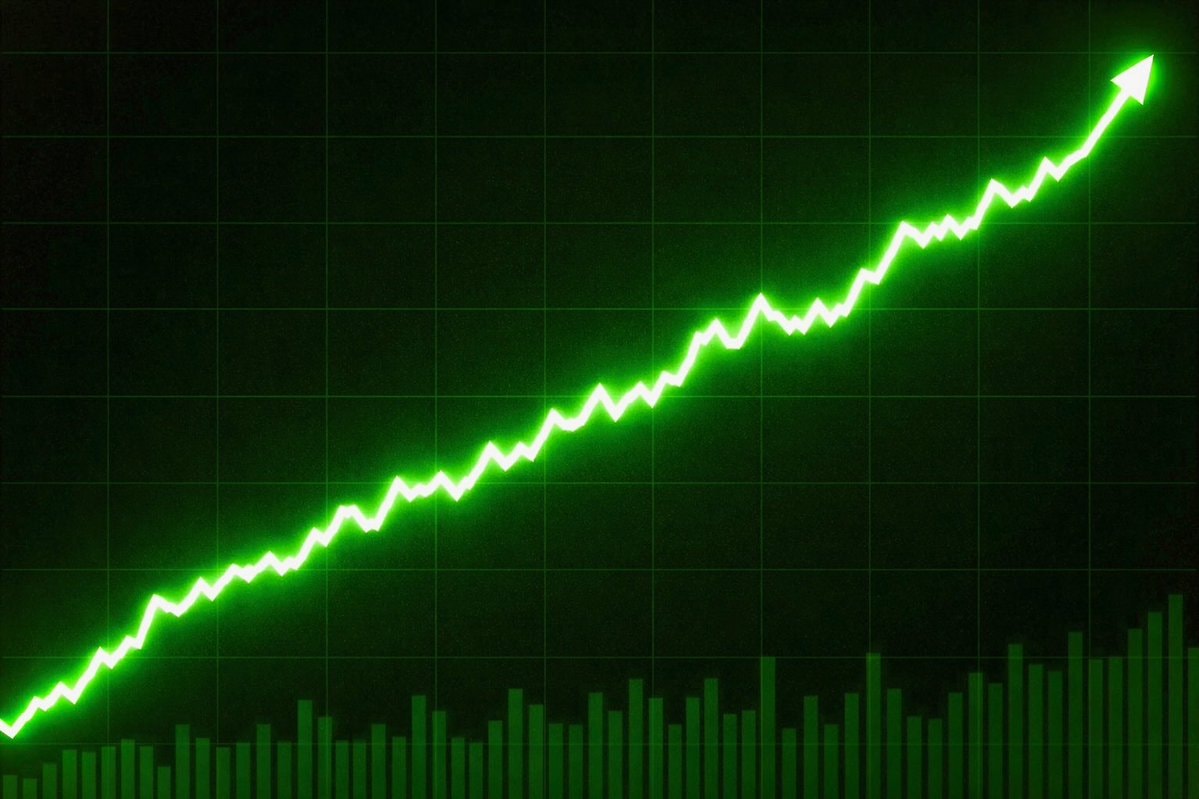
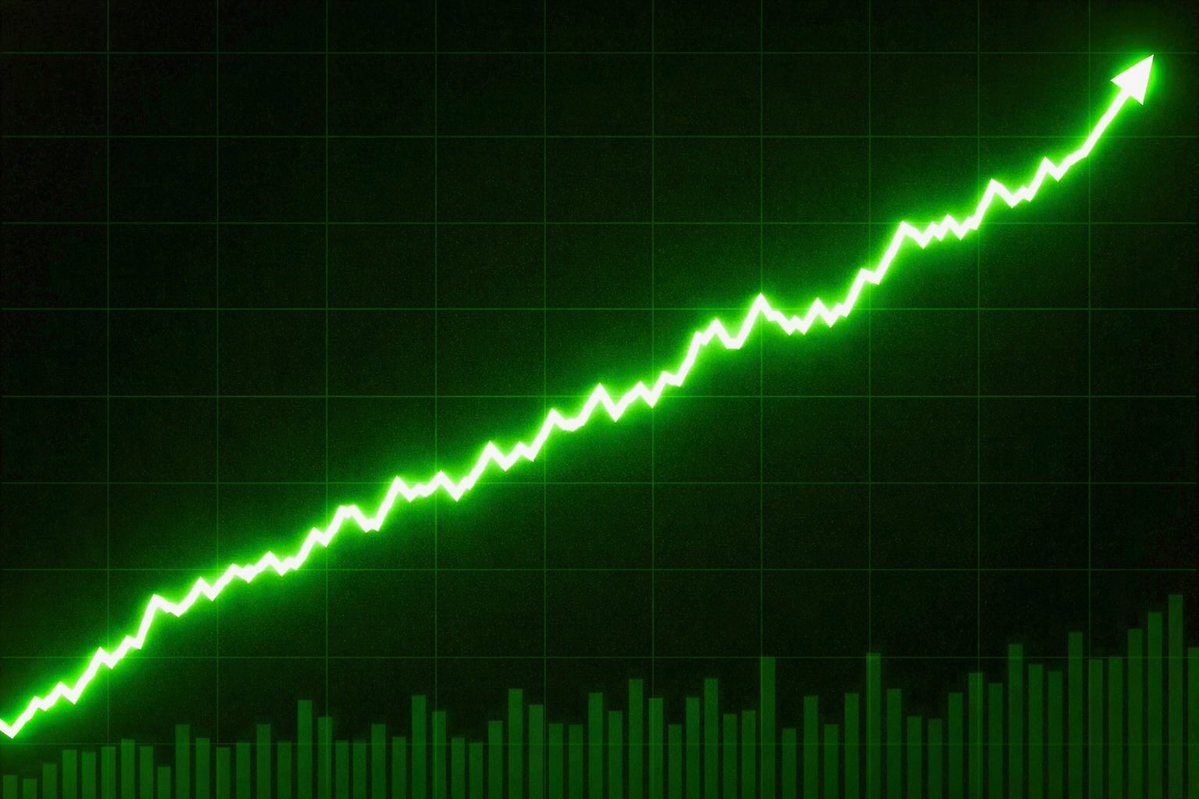
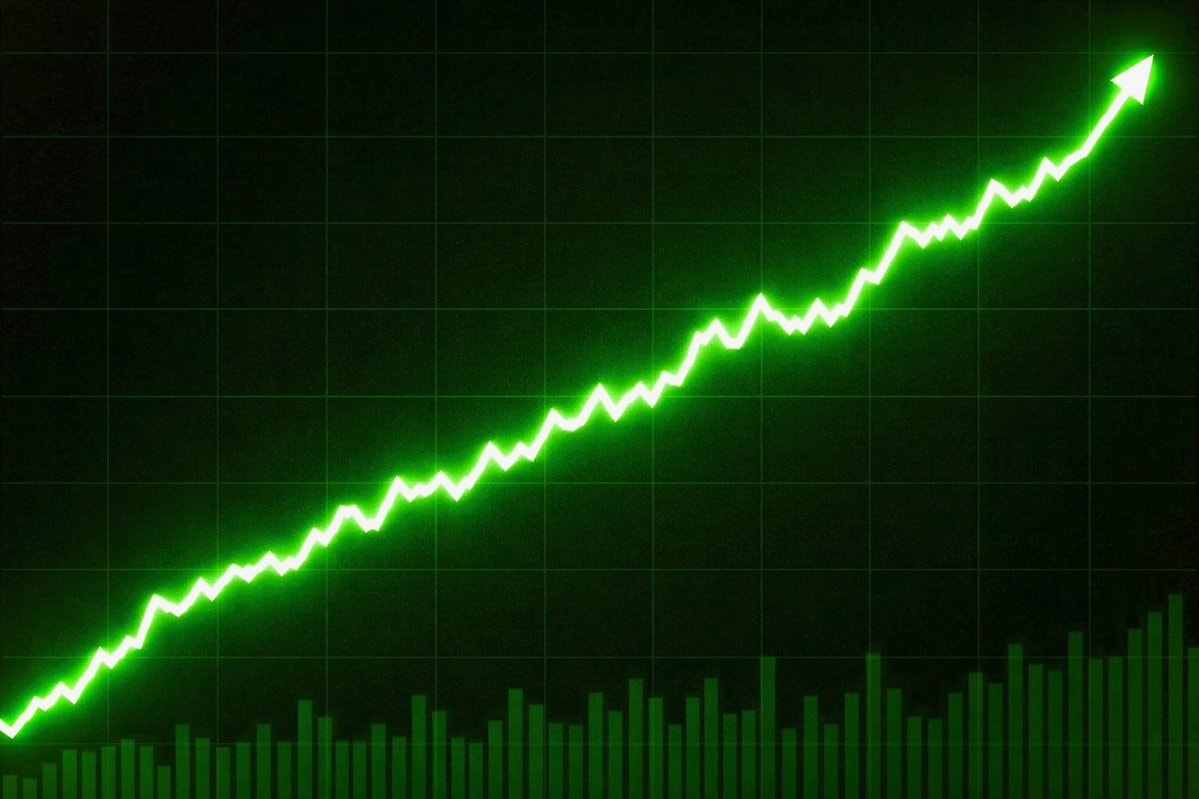
    US stock market green chart

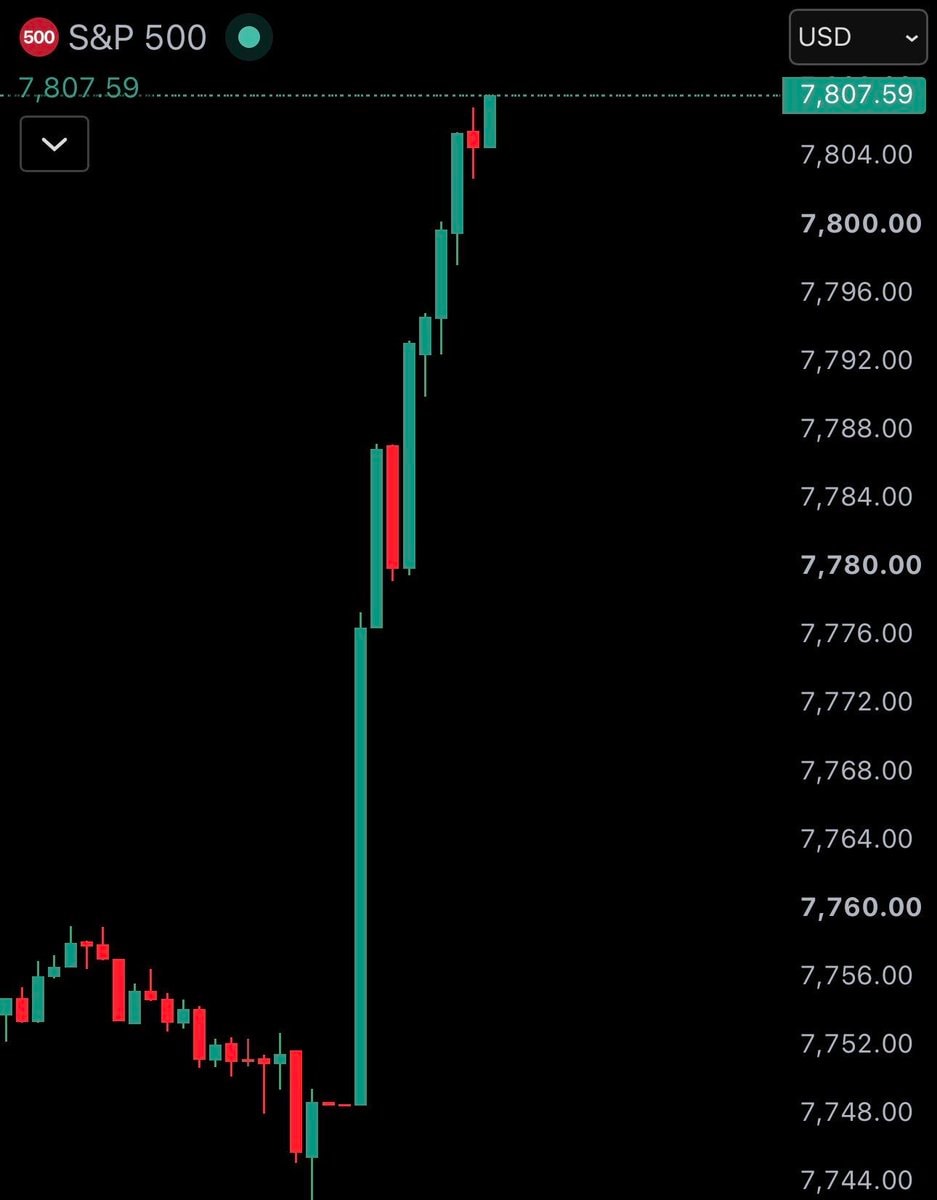
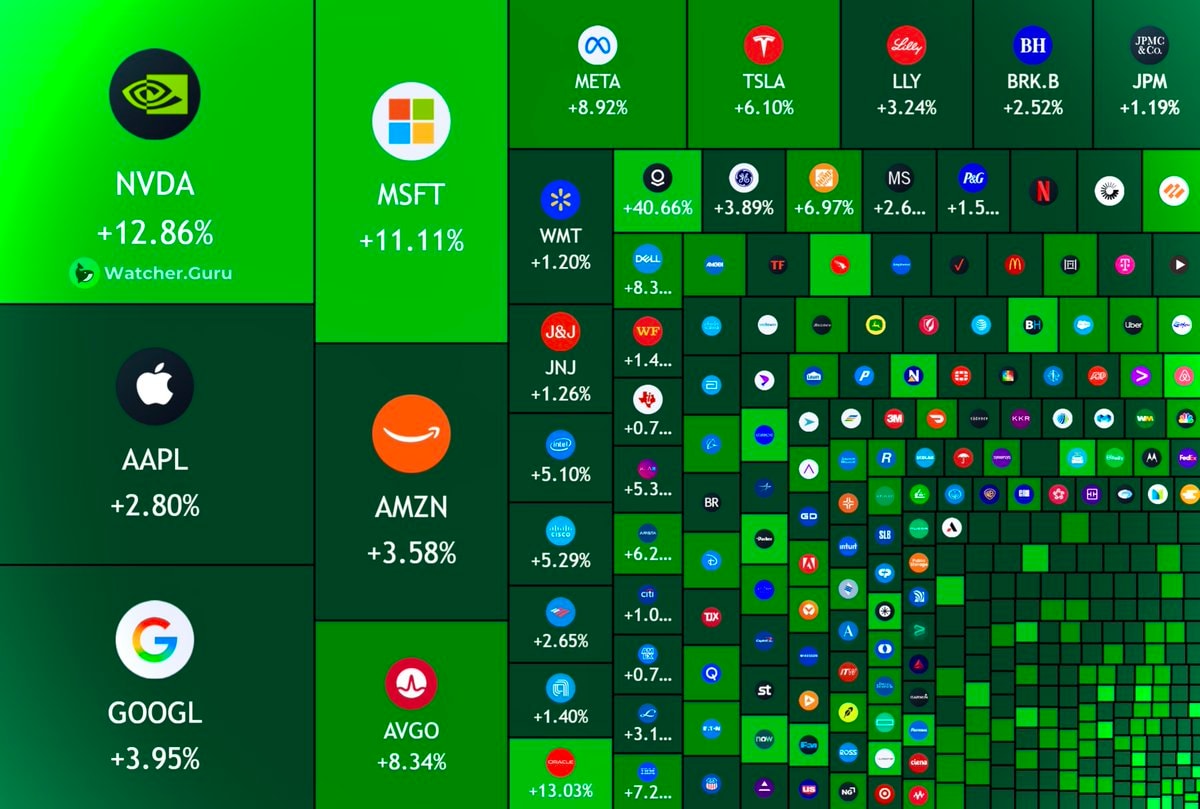
    @Jakob.erasUS stock market added $750,000,000,000 at the open

    ์›๋ณธ ๊ฒŒ์‹œ๋ฌผ ๋ณด๊ธฐ

    US stock market green chart

    @Jakob.eras๋‹˜์˜ ์‚ฌ์ง„ยท Jul 30, 2026ยท Stock Market

    ์ด ์‚ฌ์ง„์— ๋Œ€ํ•ด

    The image focuses on a financial graph. A bright green line chart shows a consistent upward trend against a dark green grid background. Below the line chart, a bar graph also displays increasing values. The overall mood is professional and data-driven, suggesting growth or positive performance. The sharp, glowing green line is visually striking.

    Stock Market ์‚ฌ์ง„ ์ „์ฒด ๋ณด๊ธฐ

    ?

    Stock Market ์‚ฌ์ง„ ๋” ๋ณด๊ธฐ

    Stock Market ์‚ฌ์ง„ ์ „์ฒด ๋ณด๊ธฐ
    S&P 500 tech sector bear marketS&P 500 tech sector bear marketS&P 500 jumps 100 points as tech reboundsS&P 500 jumps 100 points as tech reboundsSouth Korea KOSPI crashSouth Korea KOSPI crashUS S&P 500 chart wipeoutUS S&P 500 chart wipeoutUS stock market lossUS stock market lossSpaceX stock chartSpaceX stock chartUS stock market lossUS stock market lossNike stock price crash2Nike stock price crashUS stock market heatmapUS stock market heatmapS&P 500 record closeS&P 500 record closeS&P 500 hits 7,800 recordS&P 500 hits 7,800 recordUS stock market heatmapUS stock market heatmapSpaceX stock chart surgeSpaceX stock chart surgeS&P 500 turns negative2S&P 500 turns negativeMichael Burry market top 19872Michael Burry market top 1987S&P 500 new all-time highS&P 500 new all-time highS&P 500 all-time high 7,736S&P 500 all-time high 7,736S&P 500 hits 7,700S&P 500 hits 7,700
    ์‚ฌ์ง„
    ๐Ÿ† Jakob Eras
    ๐Ÿ† Jakob Eras@Jakob.eras3mo
    ๐Ÿ’ญStock Market๐Ÿ’ญFinance
    US stock market green chart

    @Jakob.erasUS stock market added $750,000,000,000 at the open

    ์›๋ณธ ๊ฒŒ์‹œ๋ฌผ ๋ณด๊ธฐ

    US stock market green chart

    @Jakob.eras๋‹˜์˜ ์‚ฌ์ง„ยท Jul 30, 2026ยท Stock Market

    ์ด ์‚ฌ์ง„์— ๋Œ€ํ•ด

    The image focuses on a financial graph. A bright green line chart shows a consistent upward trend against a dark green grid background. Below the line chart, a bar graph also displays increasing values. The overall mood is professional and data-driven, suggesting growth or positive performance. The sharp, glowing green line is visually striking.

    Stock Market ์‚ฌ์ง„ ์ „์ฒด ๋ณด๊ธฐ

    ?

    Stock Market ์‚ฌ์ง„ ๋” ๋ณด๊ธฐ

    Stock Market ์‚ฌ์ง„ ์ „์ฒด ๋ณด๊ธฐ
    S&P 500 tech sector bear marketS&P 500 tech sector bear marketS&P 500 jumps 100 points as tech reboundsS&P 500 jumps 100 points as tech reboundsSouth Korea KOSPI crashSouth Korea KOSPI crashUS S&P 500 chart wipeoutUS S&P 500 chart wipeoutUS stock market lossUS stock market lossSpaceX stock chartSpaceX stock chartUS stock market lossUS stock market lossNike stock price crash2Nike stock price crashUS stock market heatmapUS stock market heatmapS&P 500 record closeS&P 500 record closeS&P 500 hits 7,800 recordS&P 500 hits 7,800 recordUS stock market heatmapUS stock market heatmapSpaceX stock chart surgeSpaceX stock chart surgeS&P 500 turns negative2S&P 500 turns negativeMichael Burry market top 19872Michael Burry market top 1987S&P 500 new all-time highS&P 500 new all-time highS&P 500 all-time high 7,736S&P 500 all-time high 7,736S&P 500 hits 7,700S&P 500 hits 7,700