
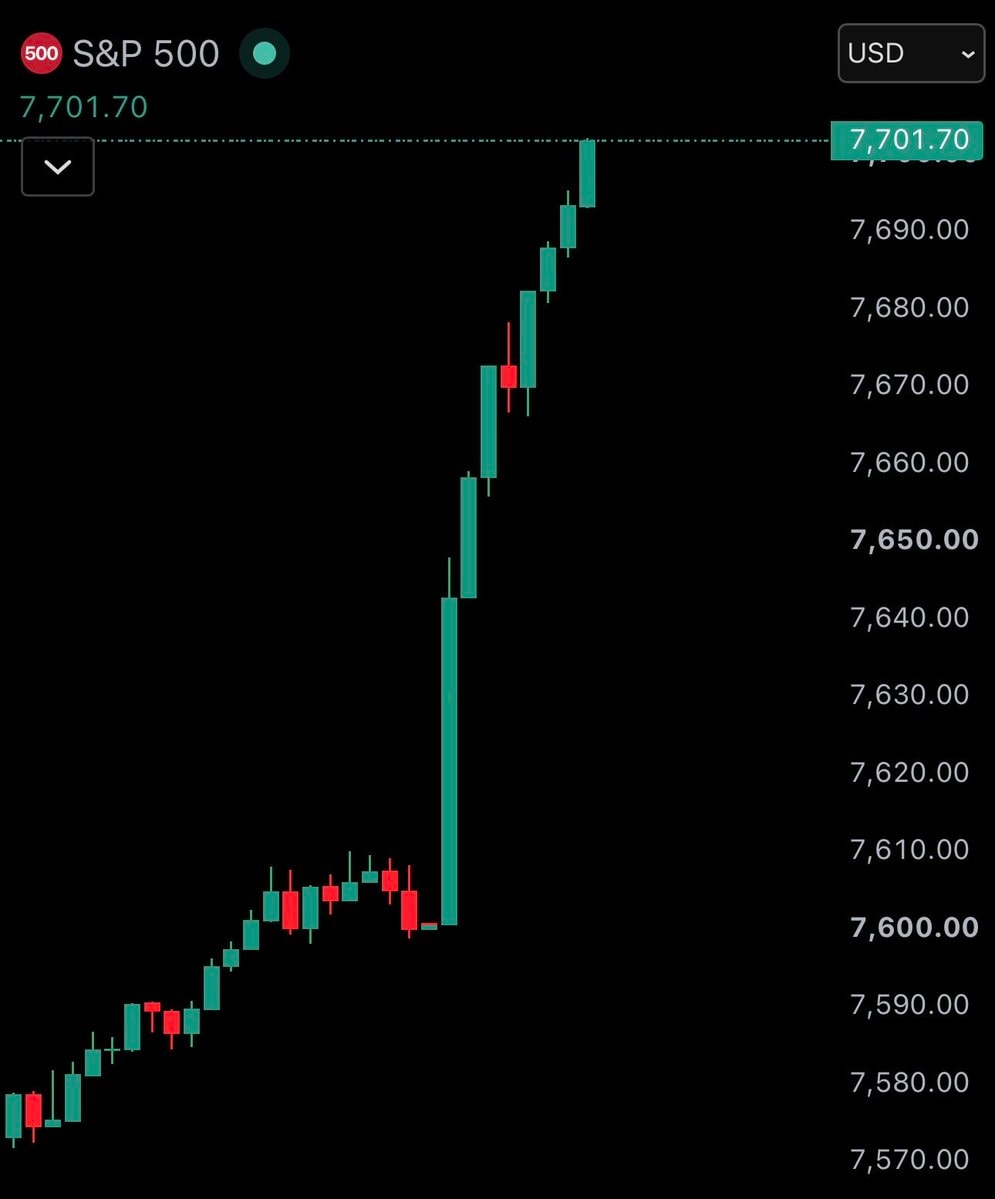
@Jakob.erasS&P 500 just touched 7,700 for the first time ever
원본 게시물 보기@Jakob.erasS&P 500 just touched 7,700 for the first time ever
원본 게시물 보기@Jakob.eras님의 사진· Aug 5, 2026· Stock Market
The focus is a financial chart displaying the S&P 500 index. The chart shows a steep upward trend with green and red candlesticks against a black background. The mood is analytical and data-driven. Visually notable is the sharp, almost vertical, surge in the S&P 500 value. ON-SCREEN TEXT: 500 S&P 500 USD 7,701.70 7,701.70 7,690.00 7,680.00 7,670.00 7,660.00 7,650.00 7,640.00 7,630.00 7,620.00 7,610.00 7,600.00 7,590.00 7,580.00 7,570.00
 S&P 500 jumps 100 points as tech rebounds
 South Korea KOSPI crash
 US S&P 500 chart wipeout
 US stock market loss
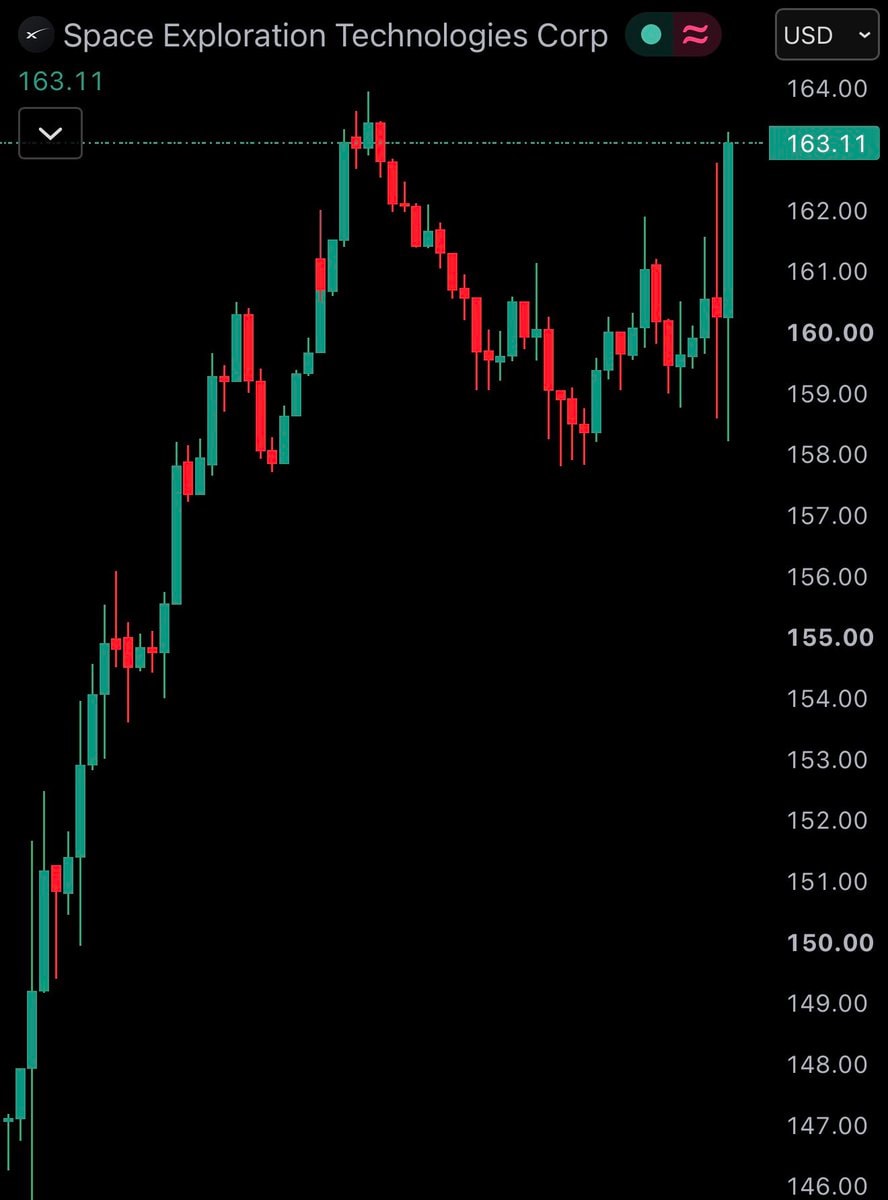 SpaceX stock chart
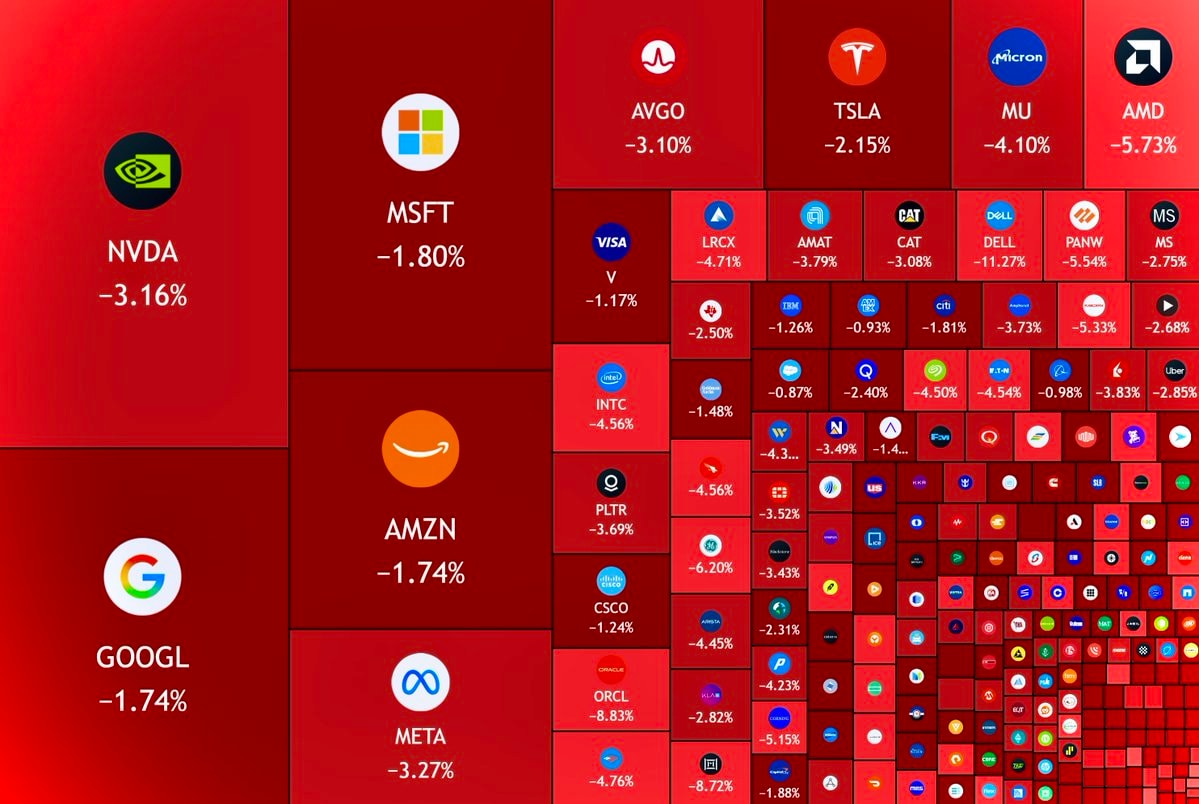 US stock market loss
 2Nike stock price crash
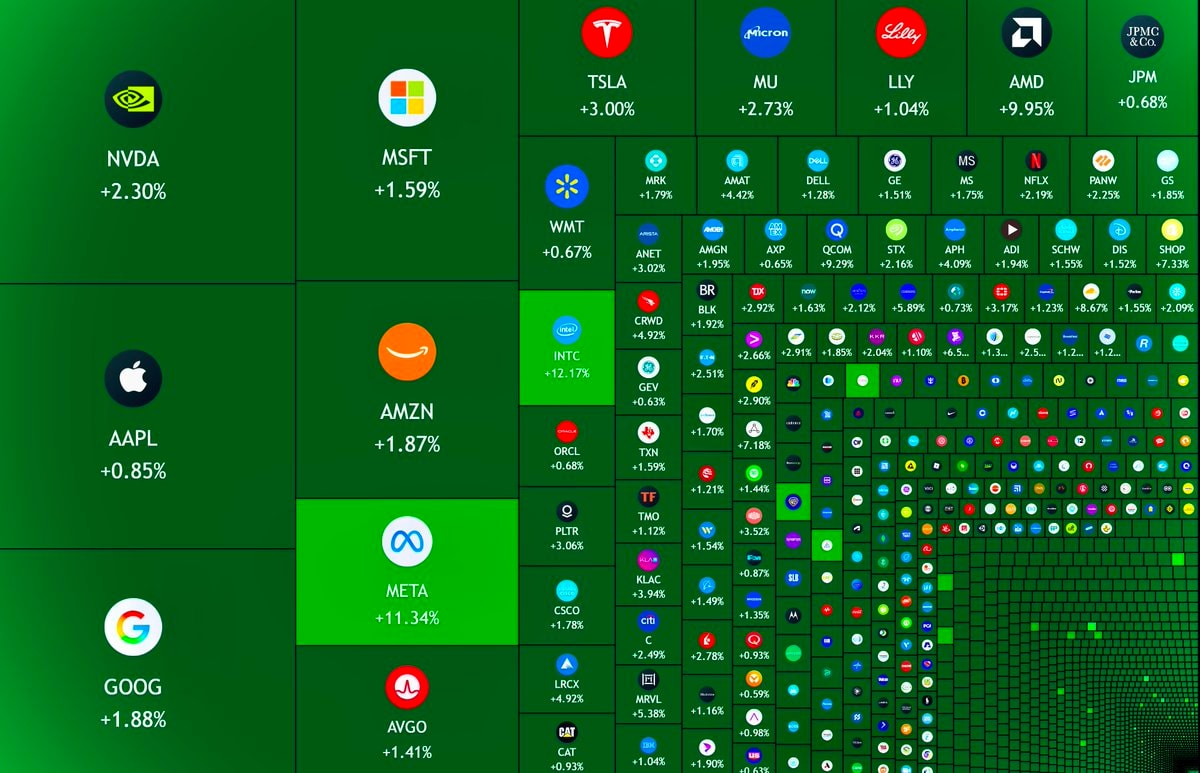 US stock market heatmap
 S&P 500 record close
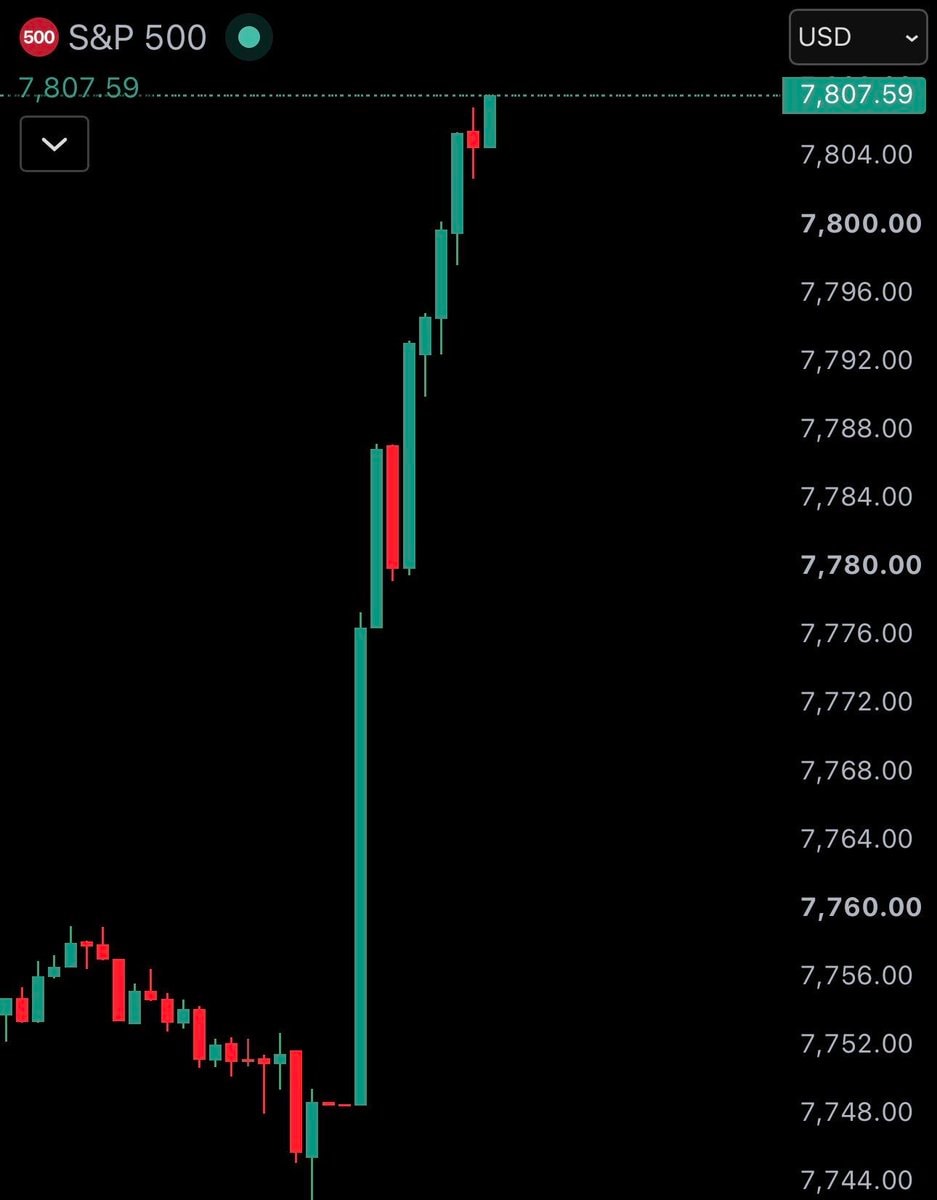 S&P 500 hits 7,800 record
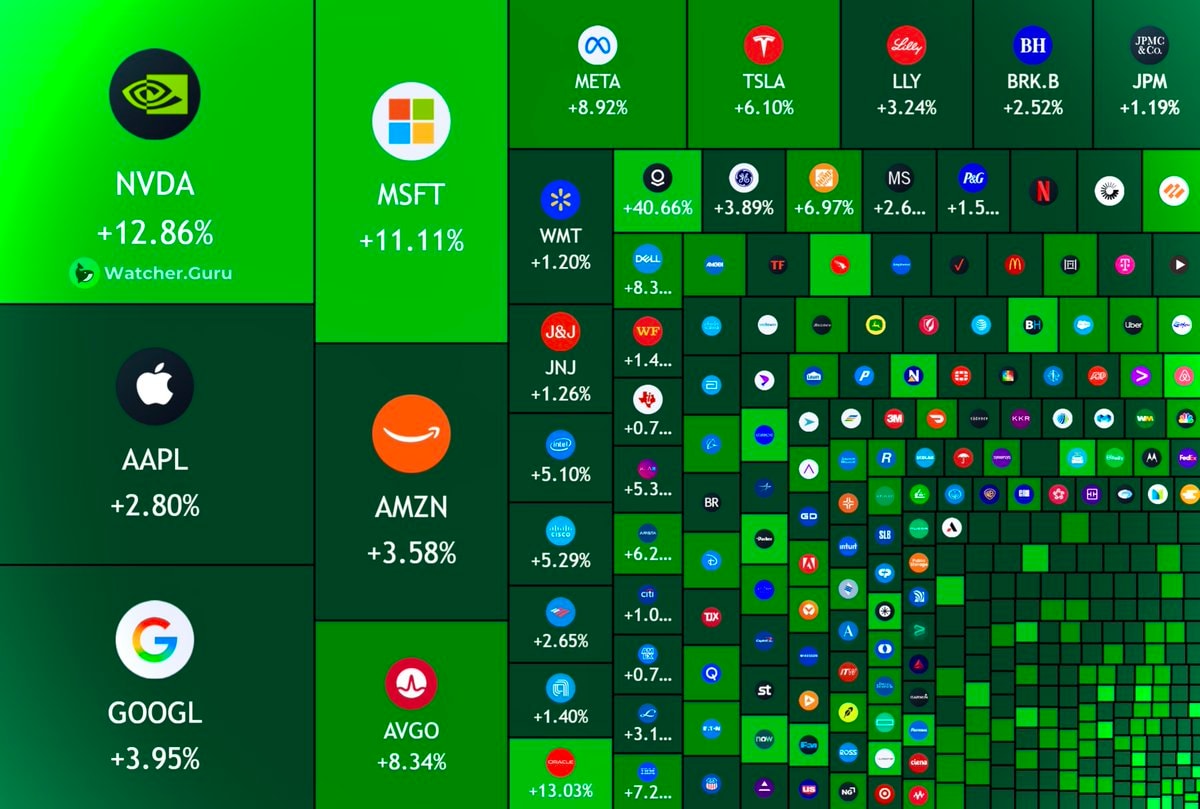 US stock market heatmap
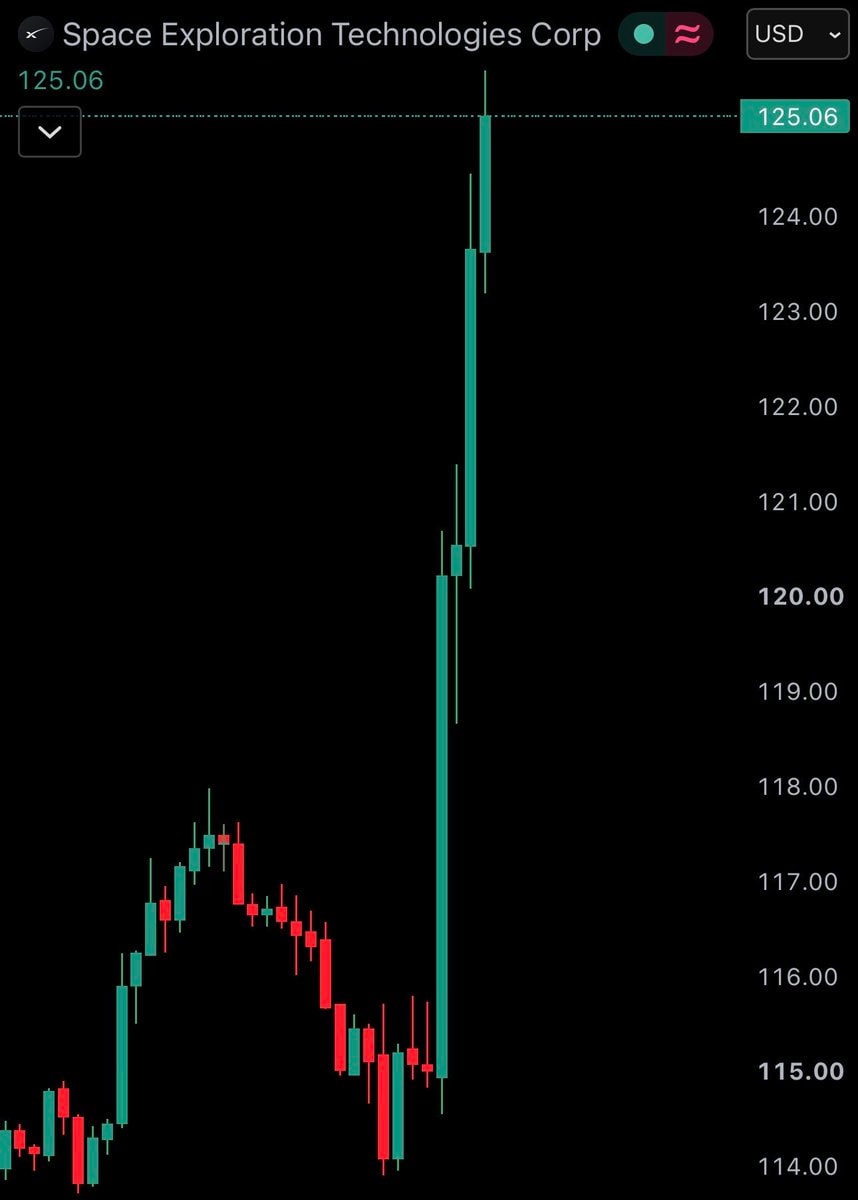 SpaceX stock chart surge
 2S&P 500 turns negative
 2Michael Burry market top 1987
 S&P 500 new all-time high
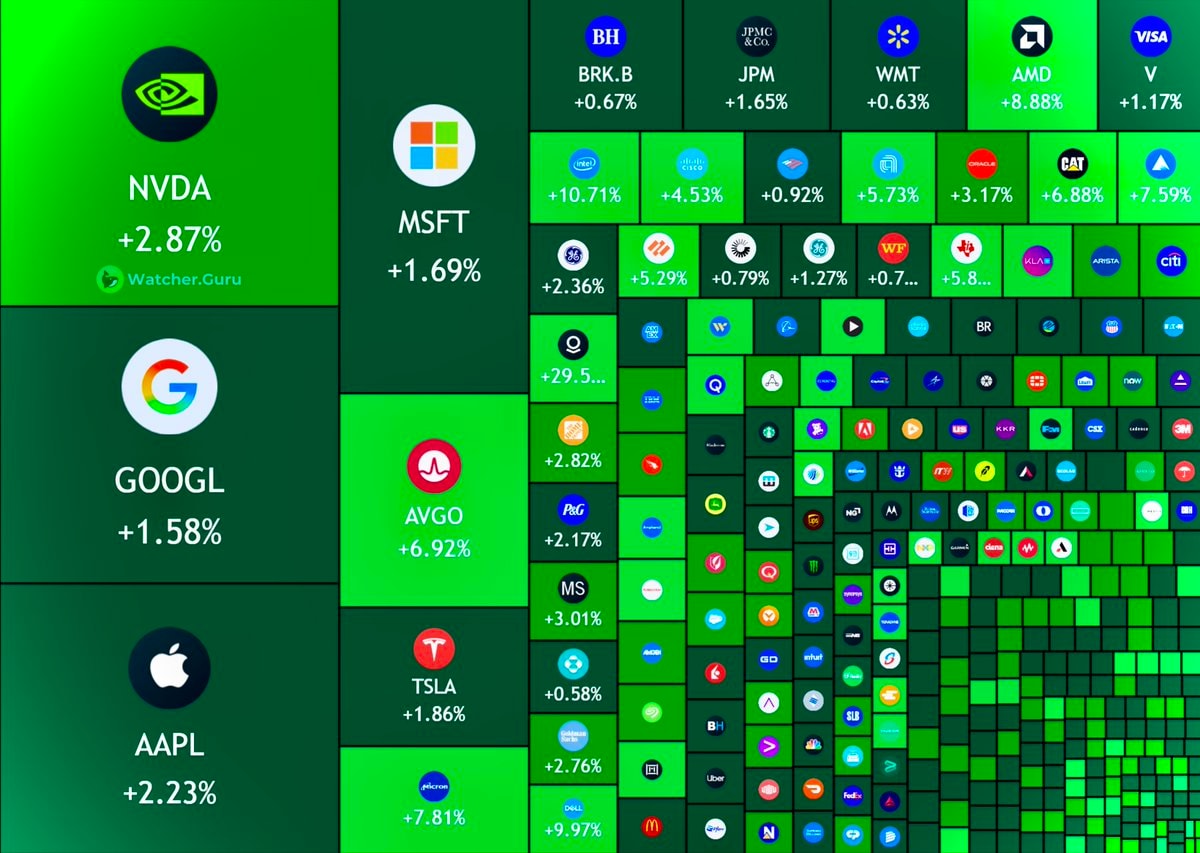 S&P 500 all-time high 7,736
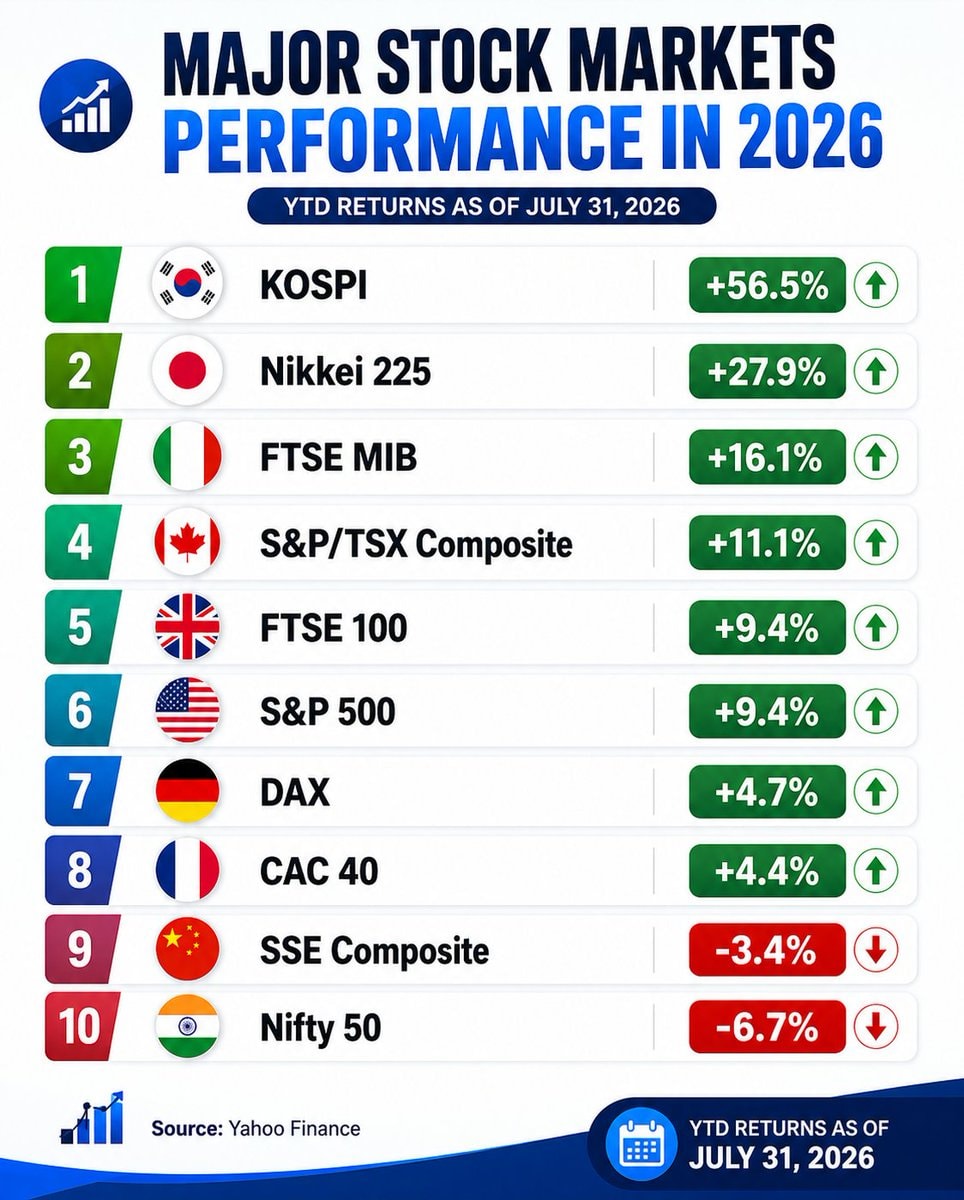 Major stock markets 2026 YTD returns
 2Amazon hits $3 trillion market cap
@Jakob.erasS&P 500 just touched 7,700 for the first time ever
원본 게시물 보기@Jakob.eras님의 사진· Aug 5, 2026· Stock Market
The focus is a financial chart displaying the S&P 500 index. The chart shows a steep upward trend with green and red candlesticks against a black background. The mood is analytical and data-driven. Visually notable is the sharp, almost vertical, surge in the S&P 500 value. ON-SCREEN TEXT: 500 S&P 500 USD 7,701.70 7,701.70 7,690.00 7,680.00 7,670.00 7,660.00 7,650.00 7,640.00 7,630.00 7,620.00 7,610.00 7,600.00 7,590.00 7,580.00 7,570.00
S&P 500 jumps 100 points as tech reboundsSouth Korea KOSPI crashUS S&P 500 chart wipeoutUS stock market lossSpaceX stock chartUS stock market loss2Nike stock price crashUS stock market heatmapS&P 500 record closeS&P 500 hits 7,800 recordUS stock market heatmapSpaceX stock chart surge2S&P 500 turns negative2Michael Burry market top 1987S&P 500 new all-time highS&P 500 all-time high 7,736Major stock markets 2026 YTD returns2Amazon hits $3 trillion market cap