
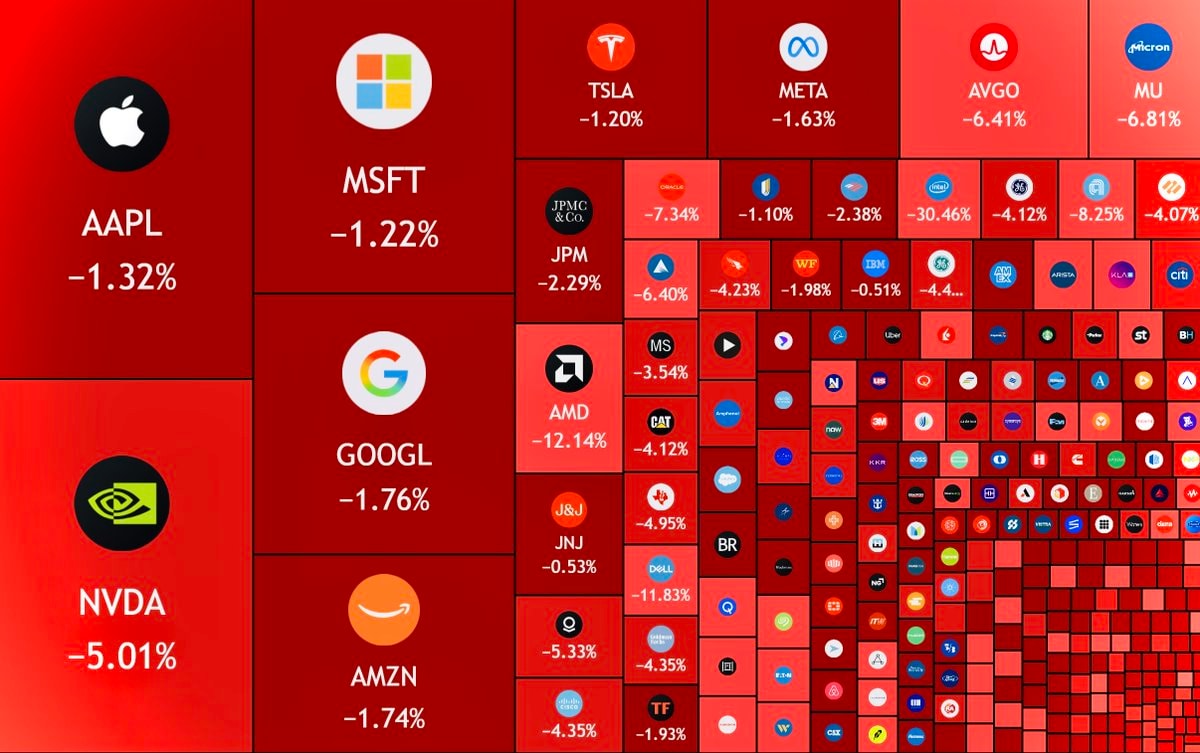
@Jakob.erasThe US stock market lost $1.8 trillion today
원본 게시물 보기@Jakob.erasThe US stock market lost $1.8 trillion today
원본 게시물 보기@Jakob.eras님의 사진· Oct 31, 2026· Finance
The image is a stock market heatmap. It displays various company logos and their stock performance, predominantly in red indicating losses. The focus is on the overall market trend with prominent companies like AAPL, MSFT, GOOGL, NVDA, TSLA, and META highlighted. The mood is serious and informative, typical of financial data visualization. Visually notable are the varying sizes of the squares representing market capitalization and the numerous company logos. ON-SCREEN TEXT: AAPL -1.32%, MSFT -1.22%, GOOGL -1.76%, NVDA -5.01%, TSLA -1.20%, META -1.63%, AVGO -6.41%, MU -6.81%, JPM -2.29%, AMD -12.14%, JNJ -0.53%, DELL -11.83%, TF -1.93%.
 2Goldman Sachs stock market warning
 Companies profit per $100 revenue
 Jeffrey Snider market analysis
 2Bitcoin probability forecast
 S&P 500 falls below 7,000
 S&P 500 tech sector bear market
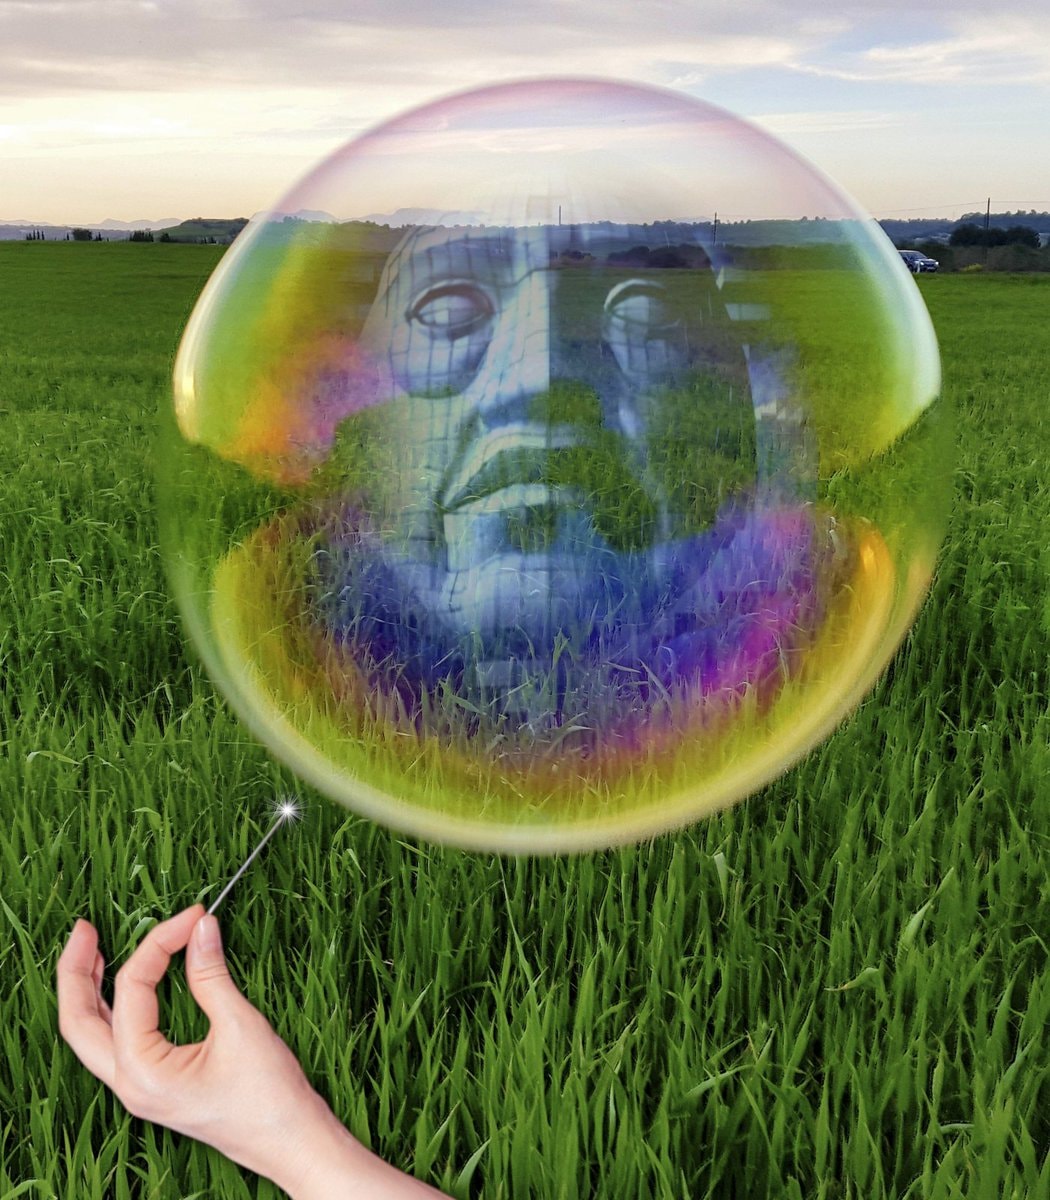 2US tech stock crash
 4Gold price chart crash
 Bitcoin price chart
 California budget crisis warning
 2Bitcoin crashes under $60,000
 2Hurun Global Rich List 2026 billionaire cities
 Gold price chart dip
 2California flag Nvidia investigation
 Bitcoin falls under $62,000
 2Anthropic employees wealth after $ANT IPO
 2Anthropic Claude AI IPO $ANT
 Abs x Memes & Markets Live
@Jakob.erasThe US stock market lost $1.8 trillion today
원본 게시물 보기@Jakob.eras님의 사진· Oct 31, 2026· Finance
The image is a stock market heatmap. It displays various company logos and their stock performance, predominantly in red indicating losses. The focus is on the overall market trend with prominent companies like AAPL, MSFT, GOOGL, NVDA, TSLA, and META highlighted. The mood is serious and informative, typical of financial data visualization. Visually notable are the varying sizes of the squares representing market capitalization and the numerous company logos. ON-SCREEN TEXT: AAPL -1.32%, MSFT -1.22%, GOOGL -1.76%, NVDA -5.01%, TSLA -1.20%, META -1.63%, AVGO -6.41%, MU -6.81%, JPM -2.29%, AMD -12.14%, JNJ -0.53%, DELL -11.83%, TF -1.93%.
2Goldman Sachs stock market warningCompanies profit per $100 revenueJeffrey Snider market analysis2Bitcoin probability forecastS&P 500 falls below 7,000S&P 500 tech sector bear market2US tech stock crash4Gold price chart crashBitcoin price chartCalifornia budget crisis warning2Bitcoin crashes under $60,0002Hurun Global Rich List 2026 billionaire citiesGold price chart dip2California flag Nvidia investigationBitcoin falls under $62,0002Anthropic employees wealth after $ANT IPO2Anthropic Claude AI IPO $ANTAbs x Memes & Markets Live