iFANN
    iFANN 검색...
    로그인
    홈
    뉴스
    동영상
    북
    사진
    GIF
    탐색
    투표
    어워드
    iFAMOUS
    위키
    애니
    룸
    알림
    메시지
    북마크
    프로필
    위키어워드iFAMOUS랭킹산업크리에이터 리워드사용자 리워드약관개인정보커뮤니티 가이드라인게시 중단 / DMCA도움말개발자

    © 2026 iFANN

    홈
    검색
    메시지
    알림
    프로필
    사진
    Tyler Dublin
    Tyler Dublin@tyler_dublin1mo
    📱Brent Crude Oil💭Finance💭Investing
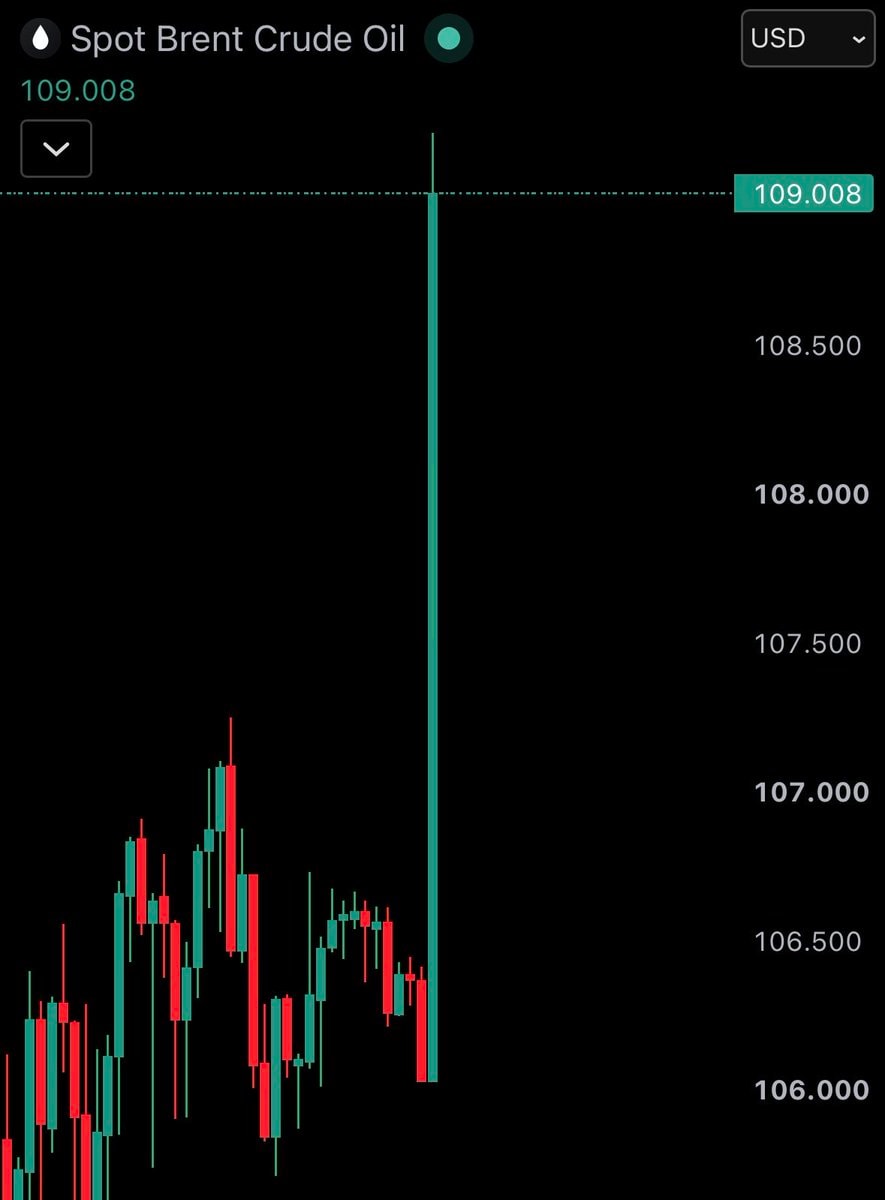
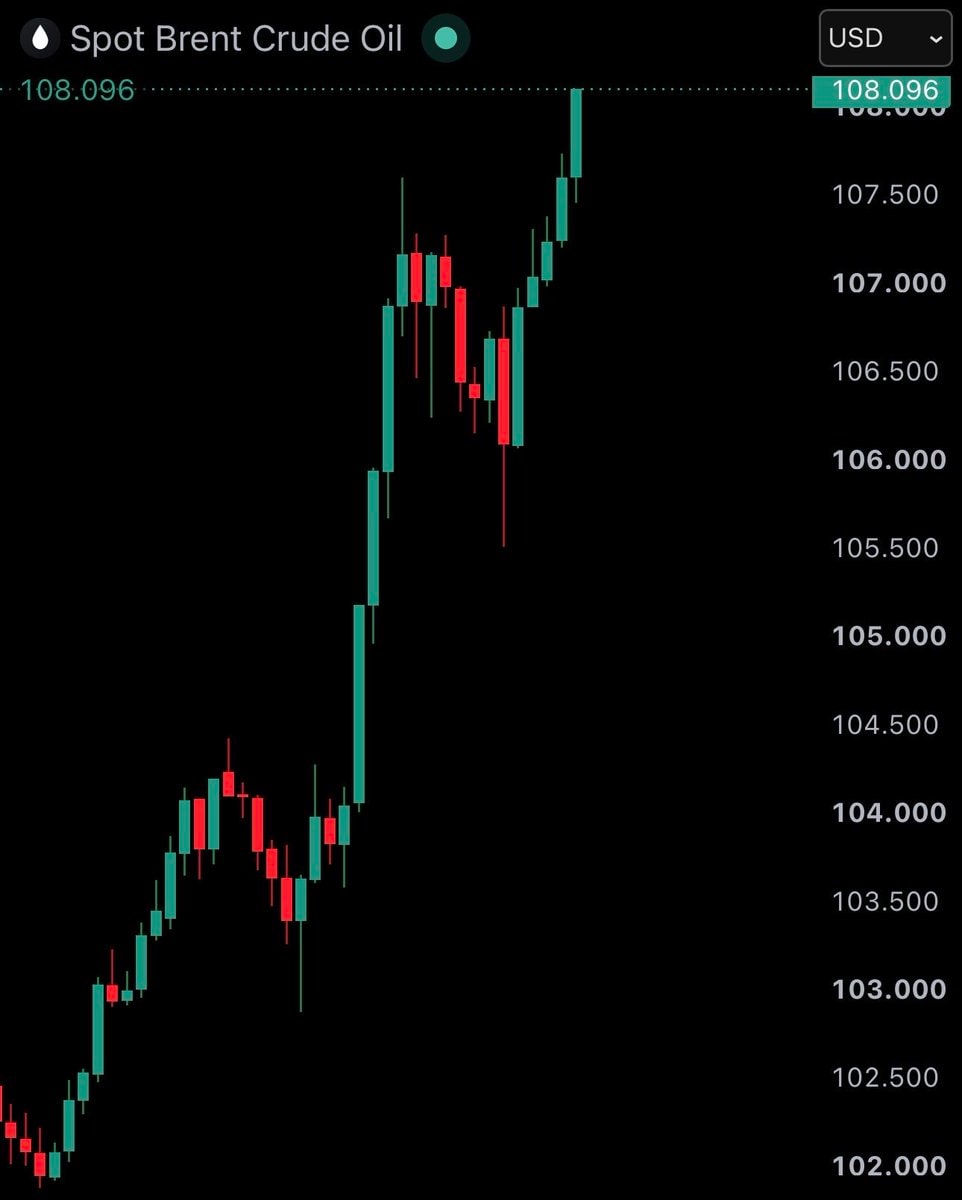
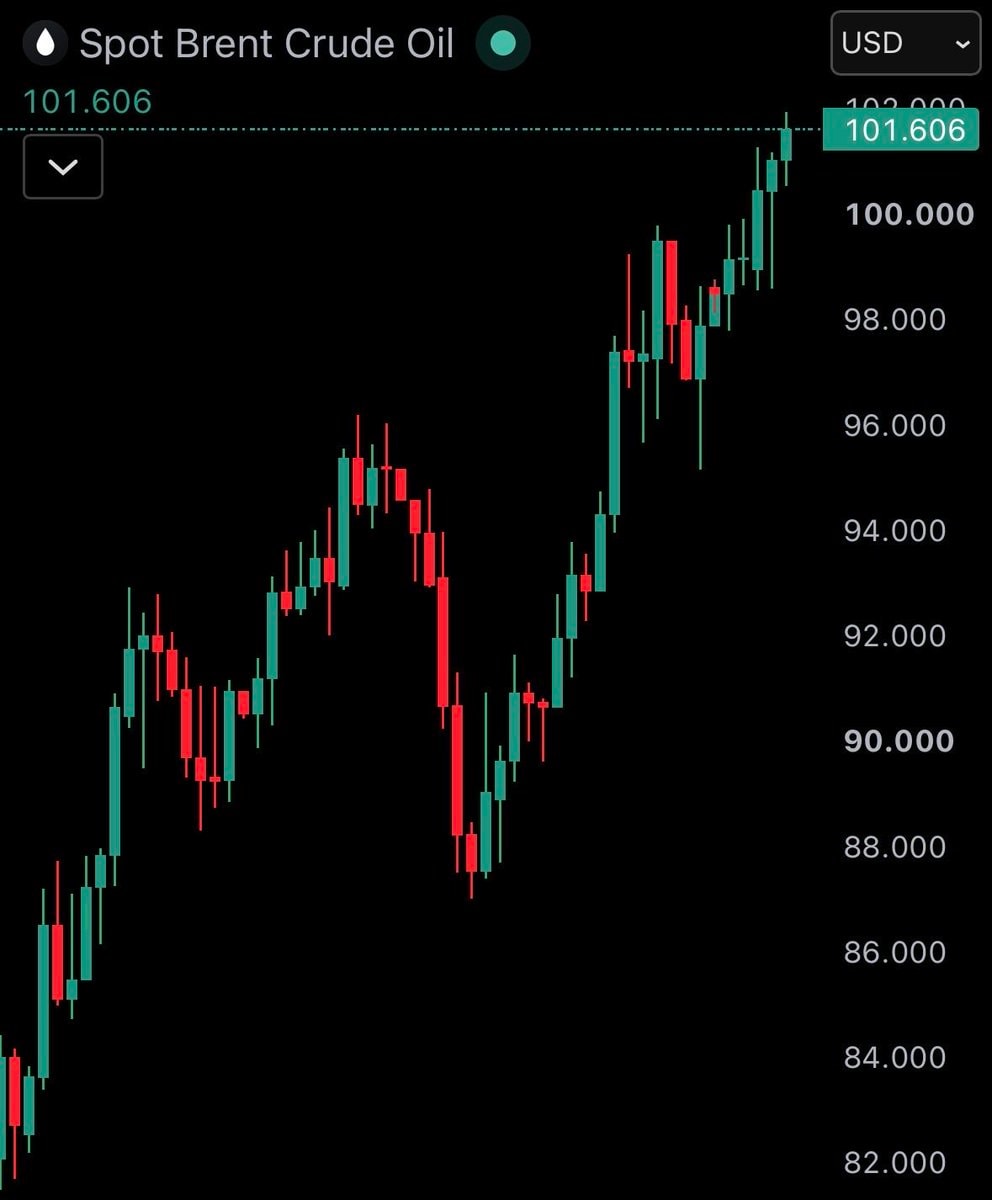
    Brent crude oil price chart

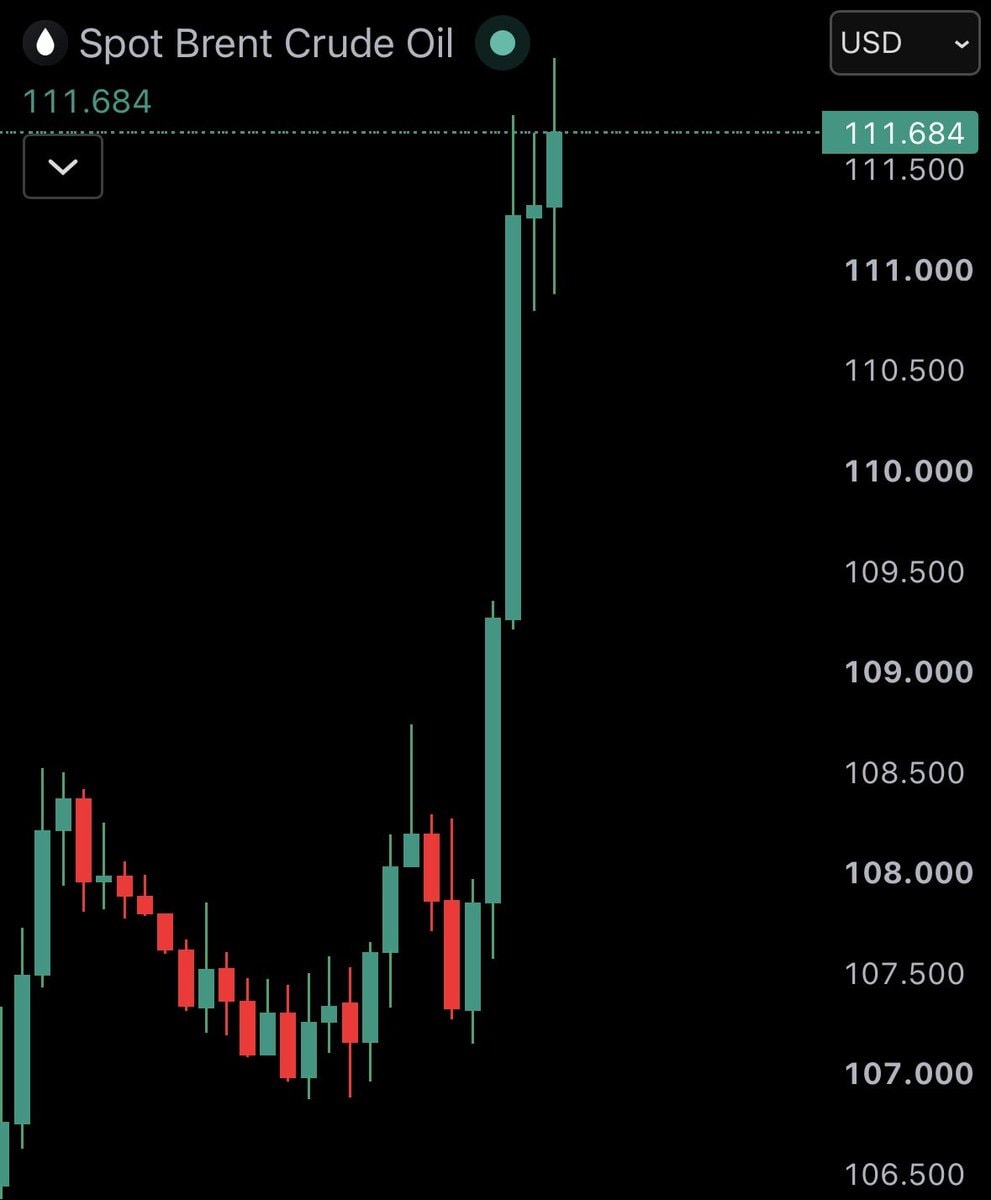
    @tyler_dublinBrent crude oil prices have risen above $111. wild though

    원본 게시물 보기

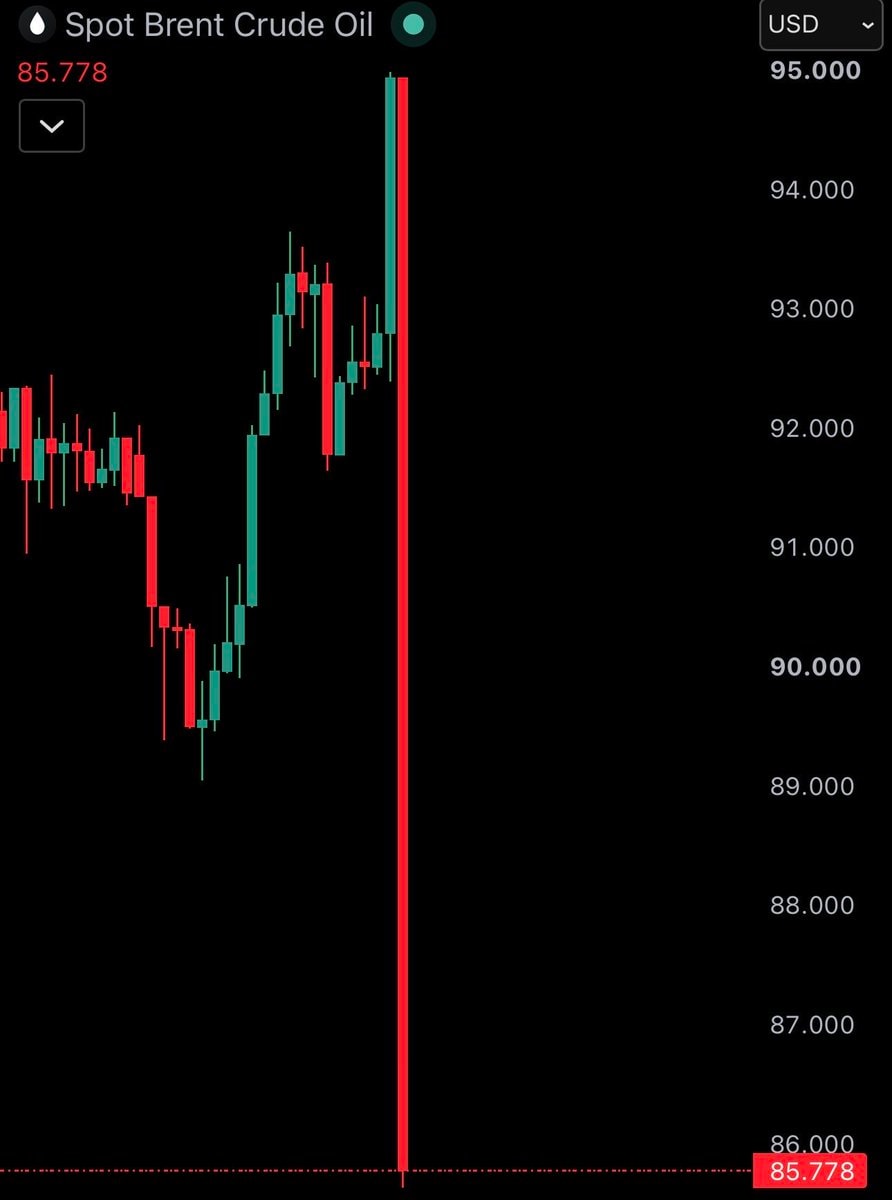
    Brent crude oil price chart

    @tyler_dublin님의 사진· Oct 17, 2026· Brent Crude Oil

    이 사진에 대해

    The focus is a financial chart displaying the price of Spot Brent Crude Oil. The chart shows a steep upward trend with green and red candlesticks against a black background. The mood is analytical and informative, typical of financial data presentation. A notable detail is the sharp spike in the price, indicating significant volatility. ON-SCREEN TEXT: Spot Brent Crude Oil 111.684 USD 111.684 111.500 111.000 110.500 110.000 109.500 109.000 108.500 108.000 107.500 107.000 106.500
    Brent Crude Oil 사진 전체 보기Brent Crude Oil 위키 읽기

    ?

    Brent Crude Oil 사진 더 보기

    Brent Crude Oil 사진 전체 보기
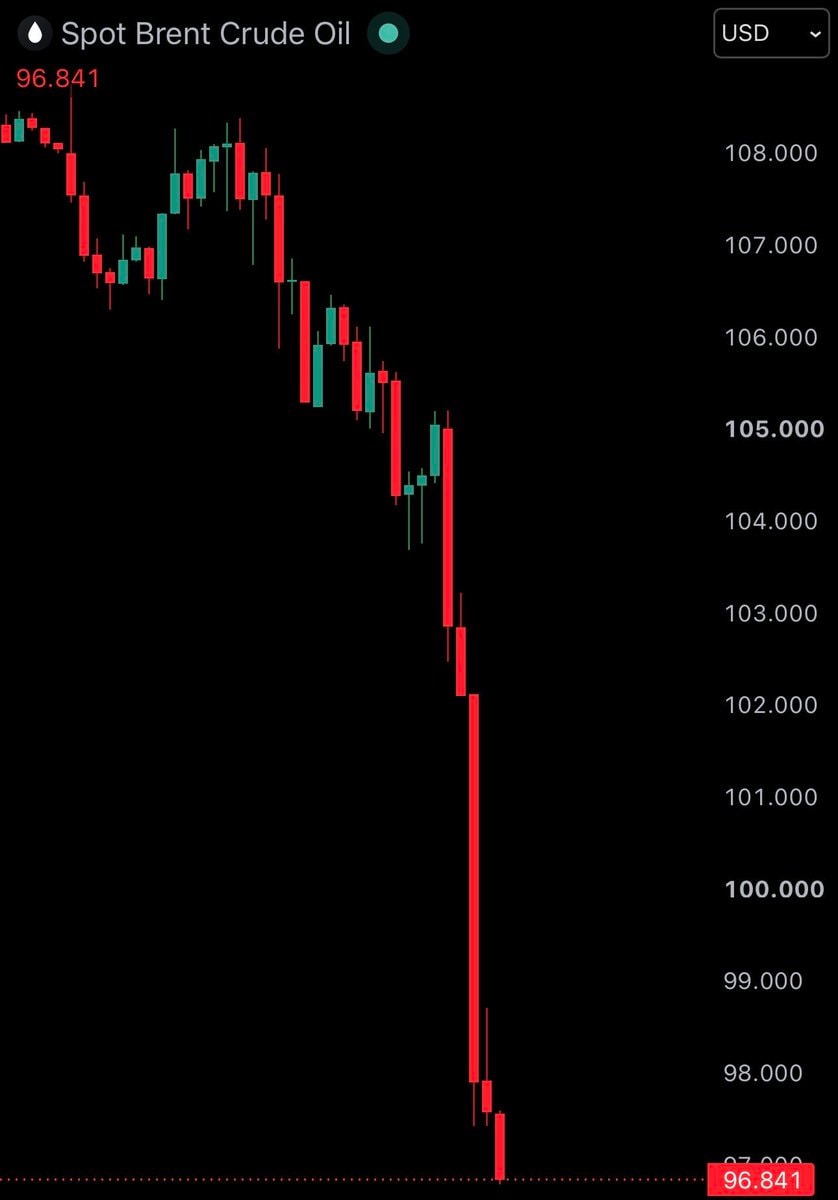
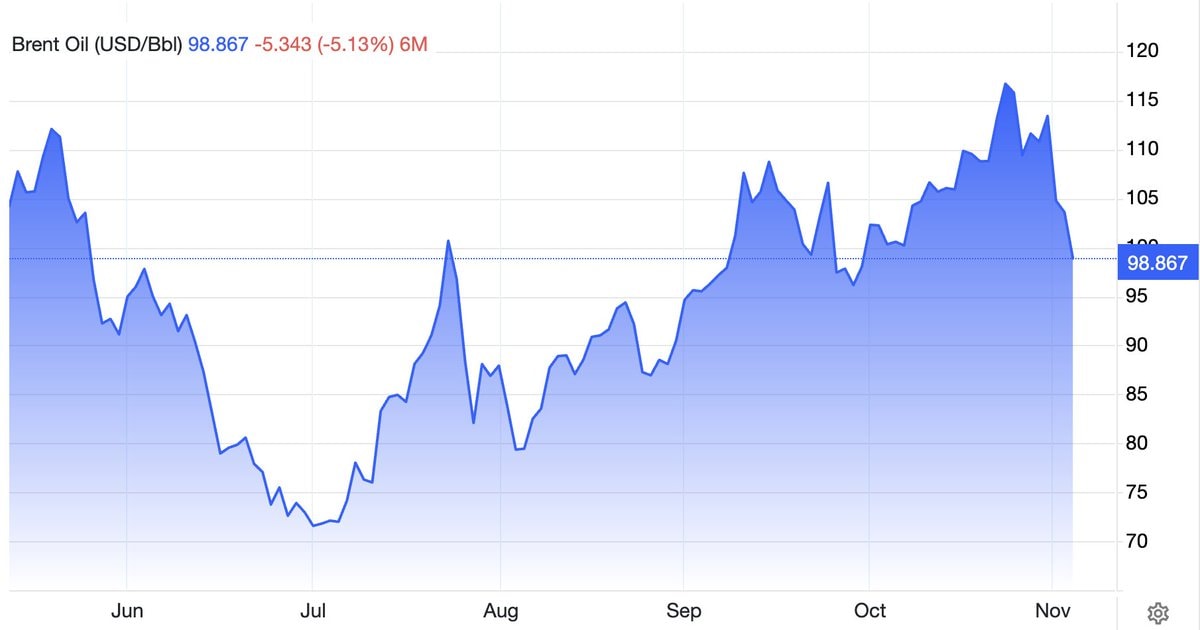
    Brent crude oil chartBrent crude oil chartBrent crude price chartBrent crude price chartBrent Crude Oil price dropBrent Crude Oil price dropBrent crude oil price surgeBrent crude oil price surgeBrent Crude Oil price chartBrent Crude Oil price chartBrent crude oil price chartBrent crude oil price chartBrent Crude Oil 10% drop after US Iran haltBrent Crude Oil 10% drop after US Iran haltBrent crude oil falls to $752Brent crude oil falls to $75
    사진
    Tyler Dublin
    Tyler Dublin@tyler_dublin1mo
    📱Brent Crude Oil💭Finance💭Investing
    Brent crude oil price chart

    @tyler_dublinBrent crude oil prices have risen above $111. wild though

    원본 게시물 보기

    Brent crude oil price chart

    @tyler_dublin님의 사진· Oct 17, 2026· Brent Crude Oil

    이 사진에 대해

    The focus is a financial chart displaying the price of Spot Brent Crude Oil. The chart shows a steep upward trend with green and red candlesticks against a black background. The mood is analytical and informative, typical of financial data presentation. A notable detail is the sharp spike in the price, indicating significant volatility. ON-SCREEN TEXT: Spot Brent Crude Oil 111.684 USD 111.684 111.500 111.000 110.500 110.000 109.500 109.000 108.500 108.000 107.500 107.000 106.500
    Brent Crude Oil 사진 전체 보기Brent Crude Oil 위키 읽기

    ?

    Brent Crude Oil 사진 더 보기

    Brent Crude Oil 사진 전체 보기
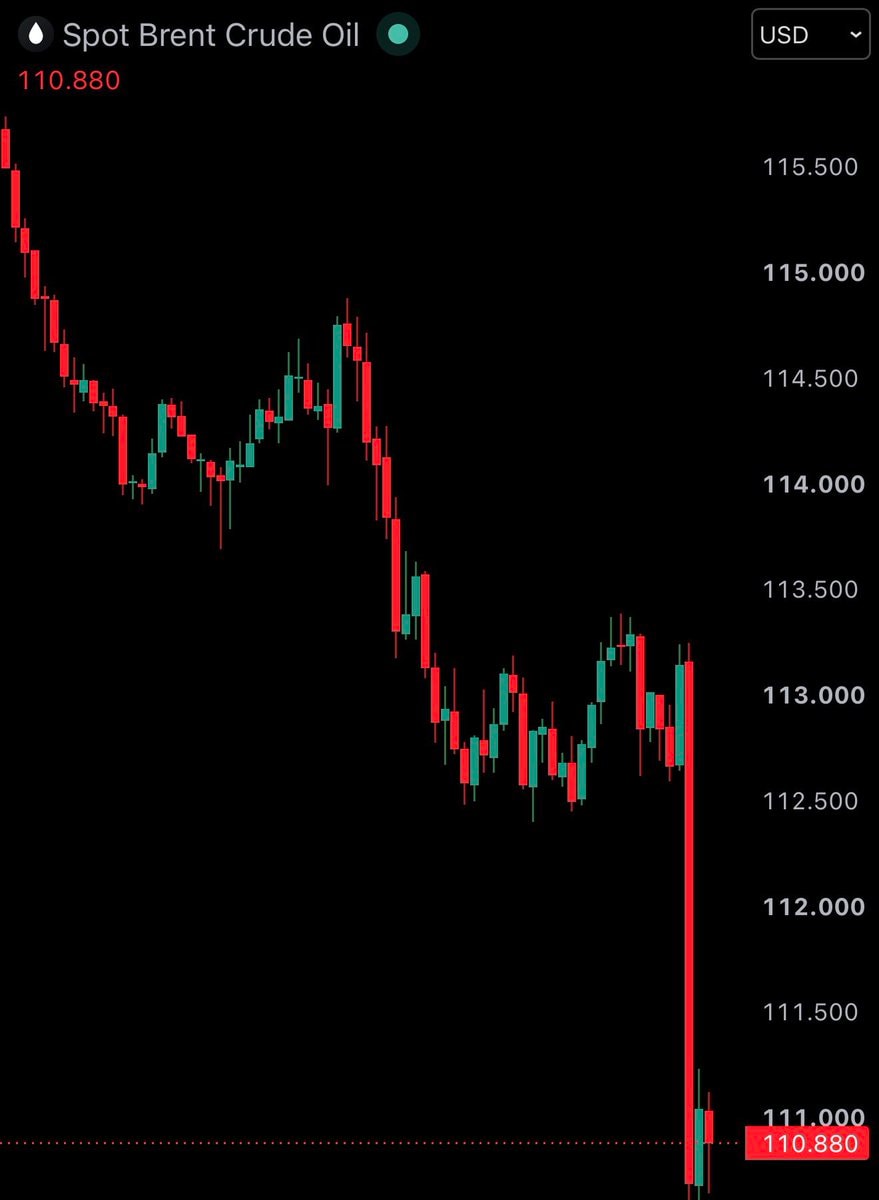
    Brent crude oil chartBrent crude oil chartBrent crude price chartBrent crude price chartBrent Crude Oil price dropBrent Crude Oil price dropBrent crude oil price surgeBrent crude oil price surgeBrent Crude Oil price chartBrent Crude Oil price chartBrent crude oil price chartBrent crude oil price chartBrent Crude Oil 10% drop after US Iran haltBrent Crude Oil 10% drop after US Iran haltBrent crude oil falls to $752Brent crude oil falls to $75