
사진
Gold
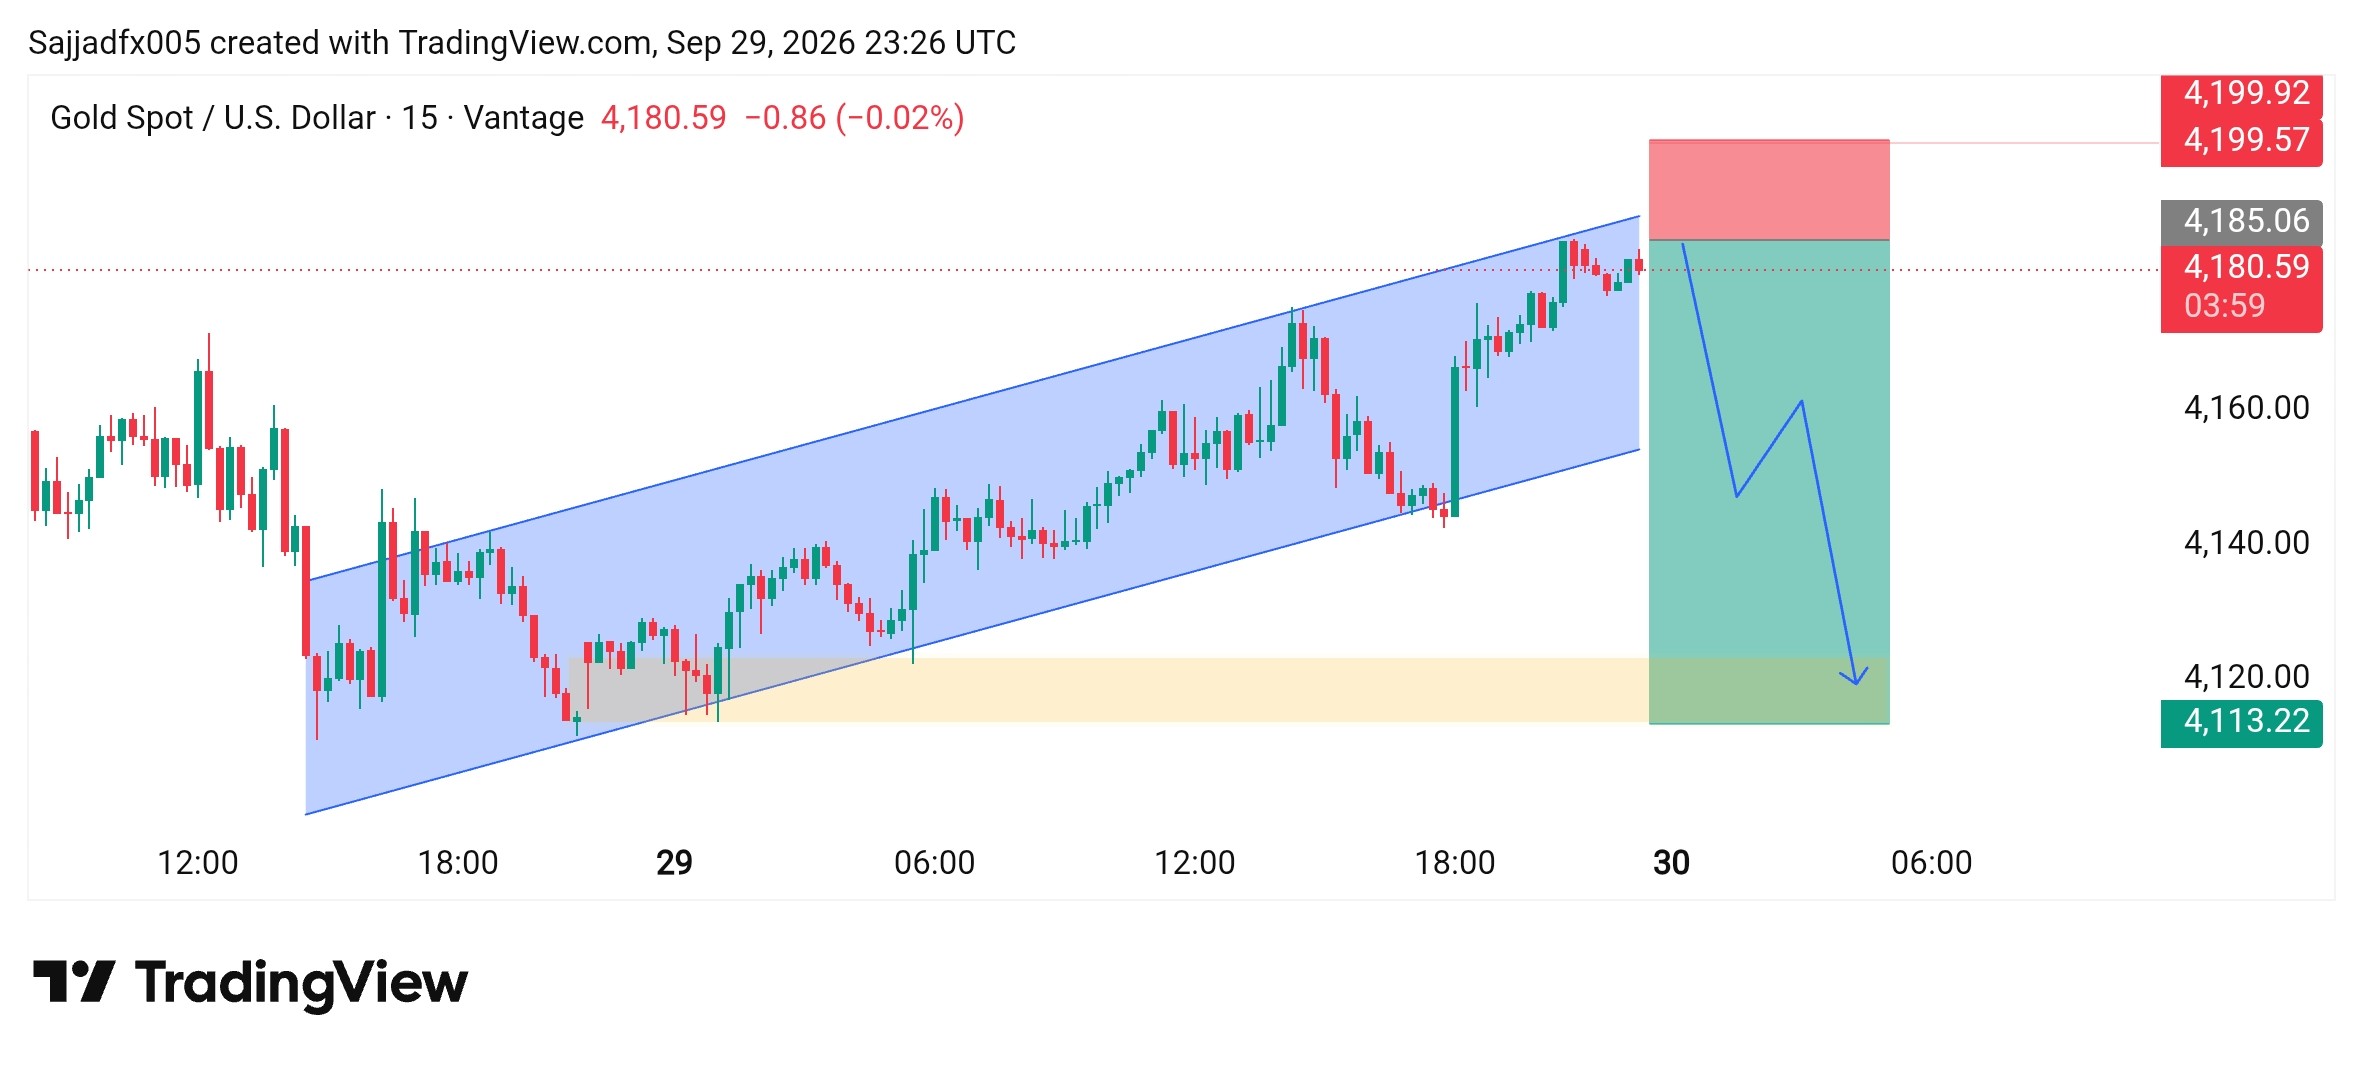
@Xauusd_1님의 사진· Sep 30, 2026· TradingView
이 사진에 대해
The image is a financial trading chart. It displays candlestick patterns representing the price movement of Gold Spot / U.S. Dollar over time. A blue channel highlights an upward trend, with a projected downward movement indicated by a blue line and shaded green and red zones. The style is technical and analytical. ON-SCREEN TEXT: Sajjadfx005 created with TradingView.com, Sep 29, 2026 23:26 UTC Gold Spot / U.S. Dollar · 15 · Vantage 4,180.59 -0.86 (-0.02%) 4,199.92 4,199.57 4,185.06 4,180.59 03:59 4,160.00 4,140.00 4,120.00 4,113.22 12:00 18:0
?


아직 댓글이 없습니다. 첫 댓글을 남겨보세요!