사진
Gold
@Xauusd_1님의 사진· Sep 21, 2026· Post Malone
이 사진에 대해
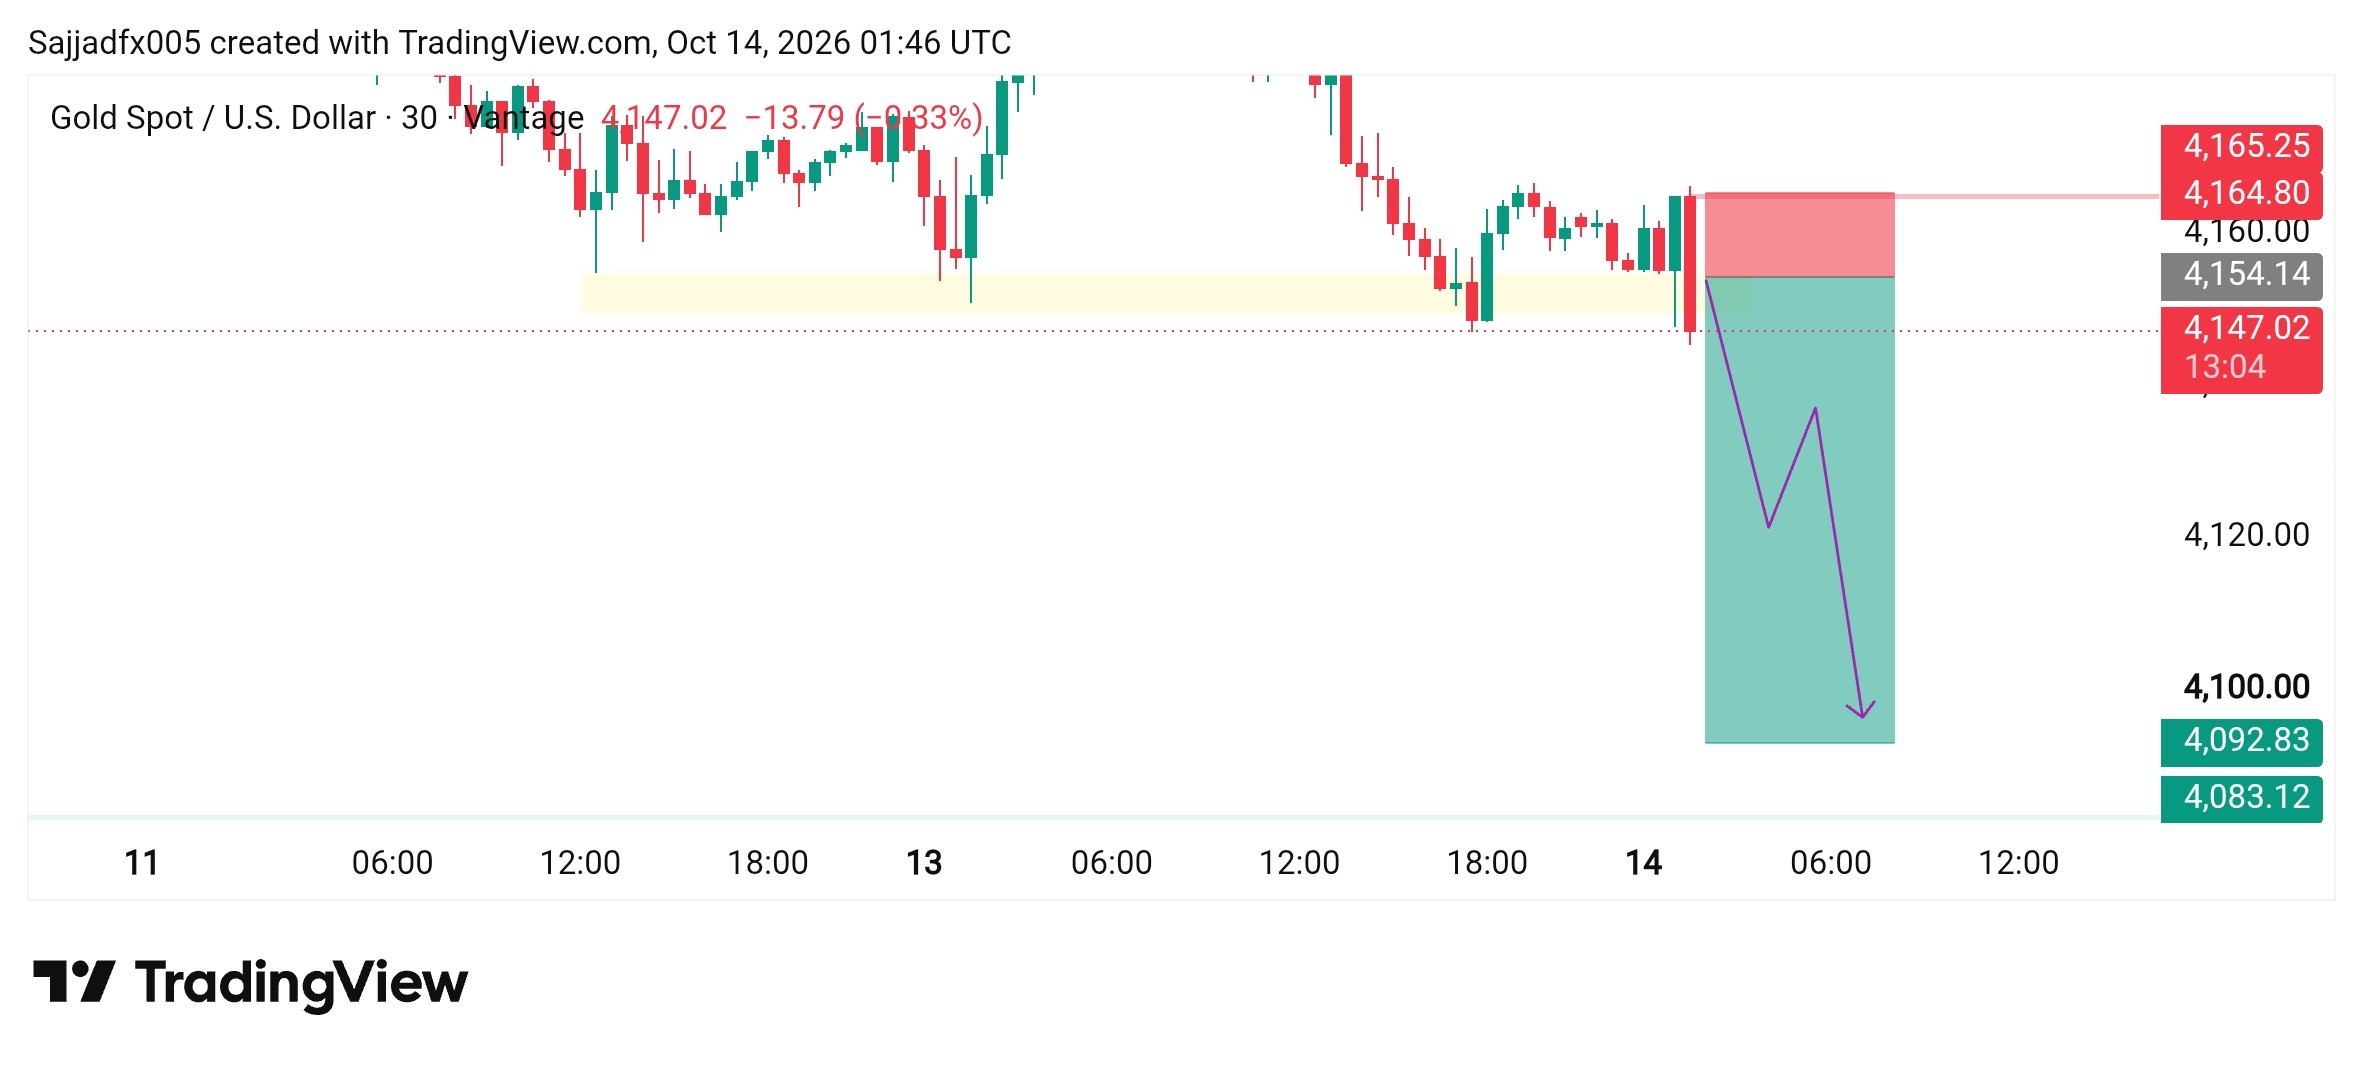
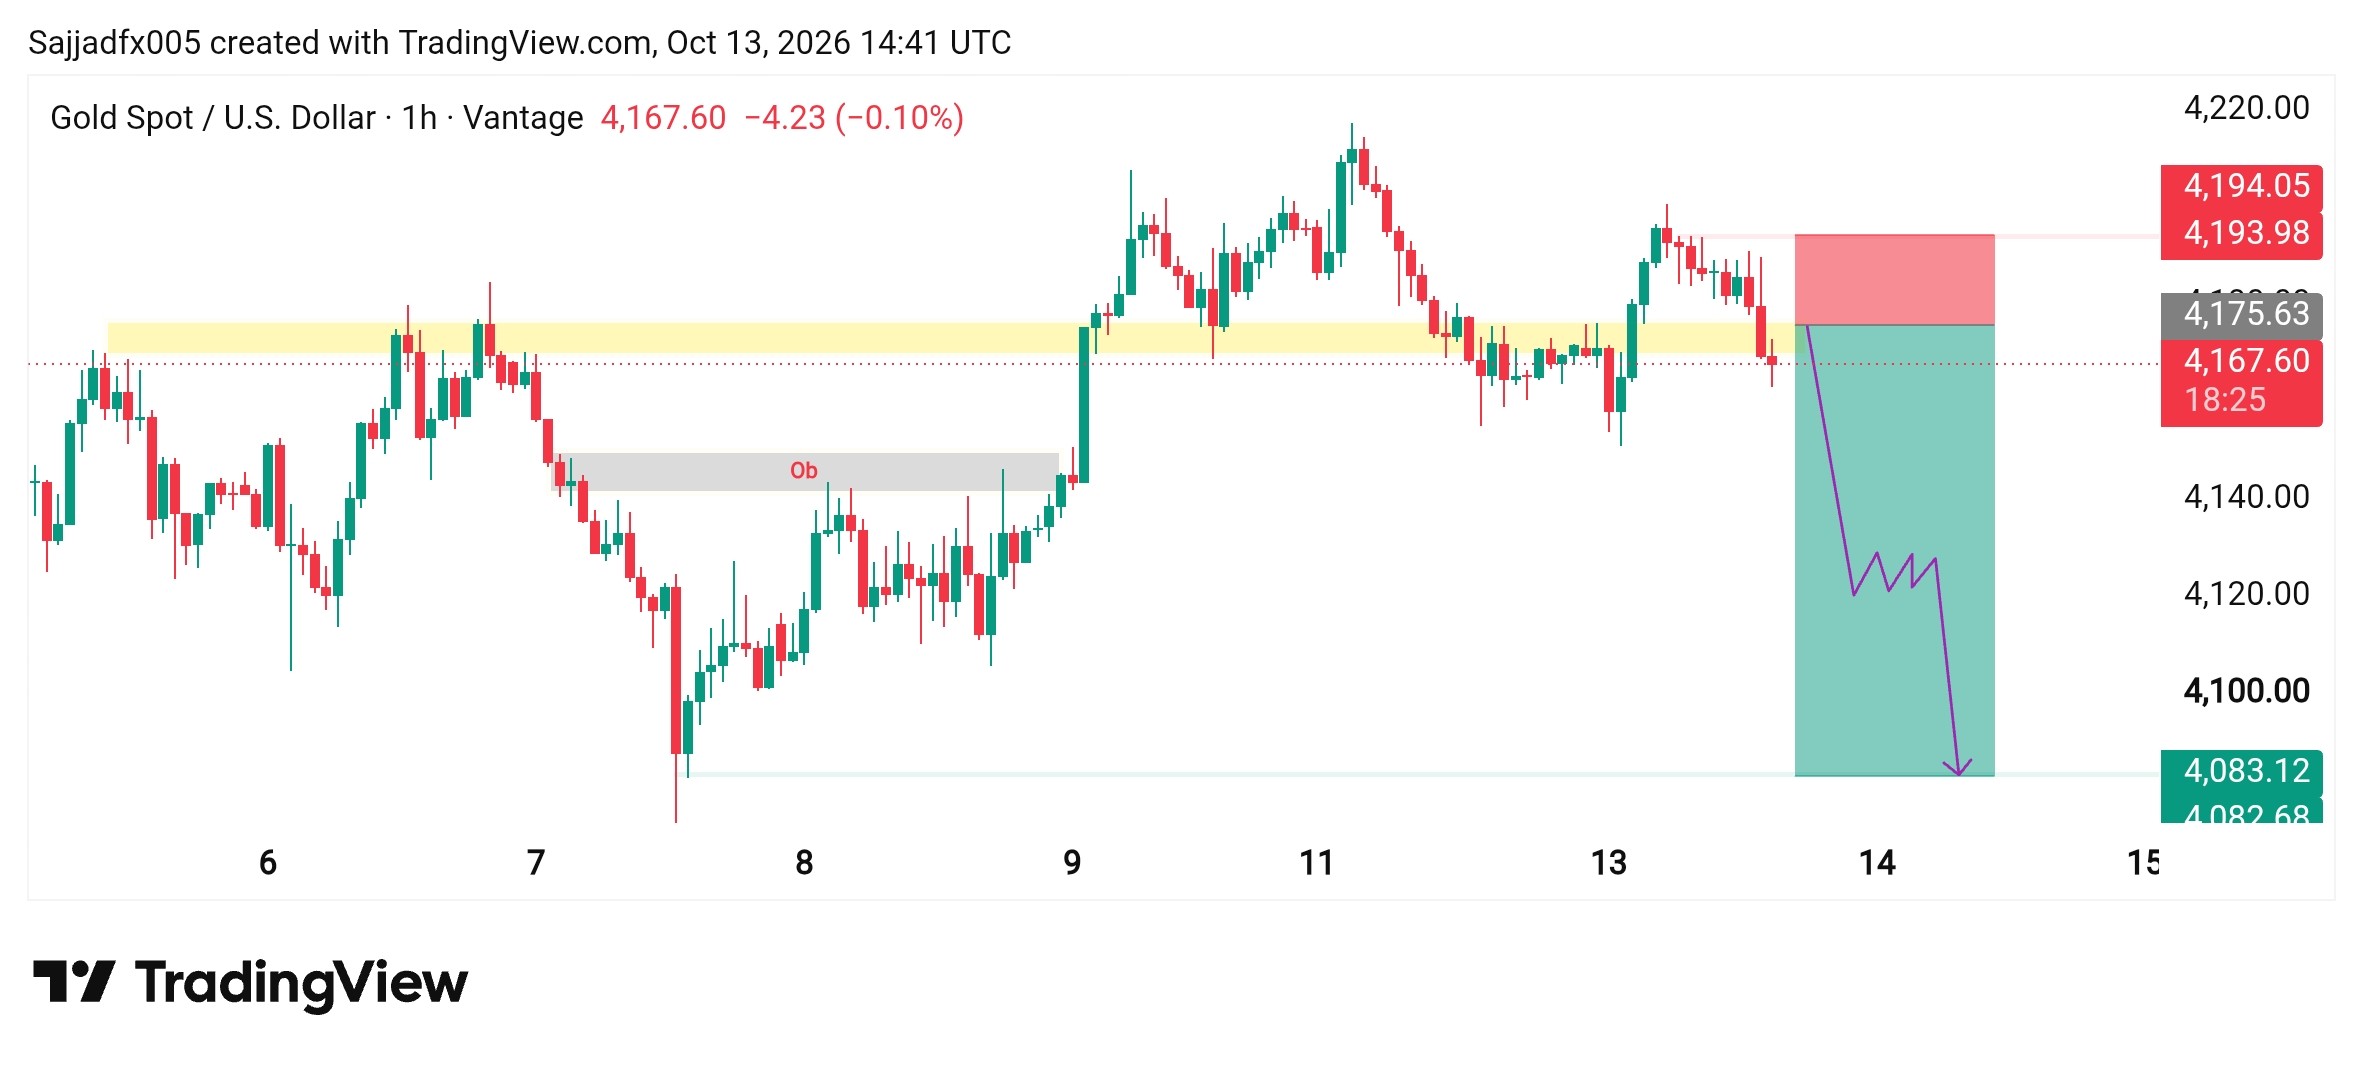
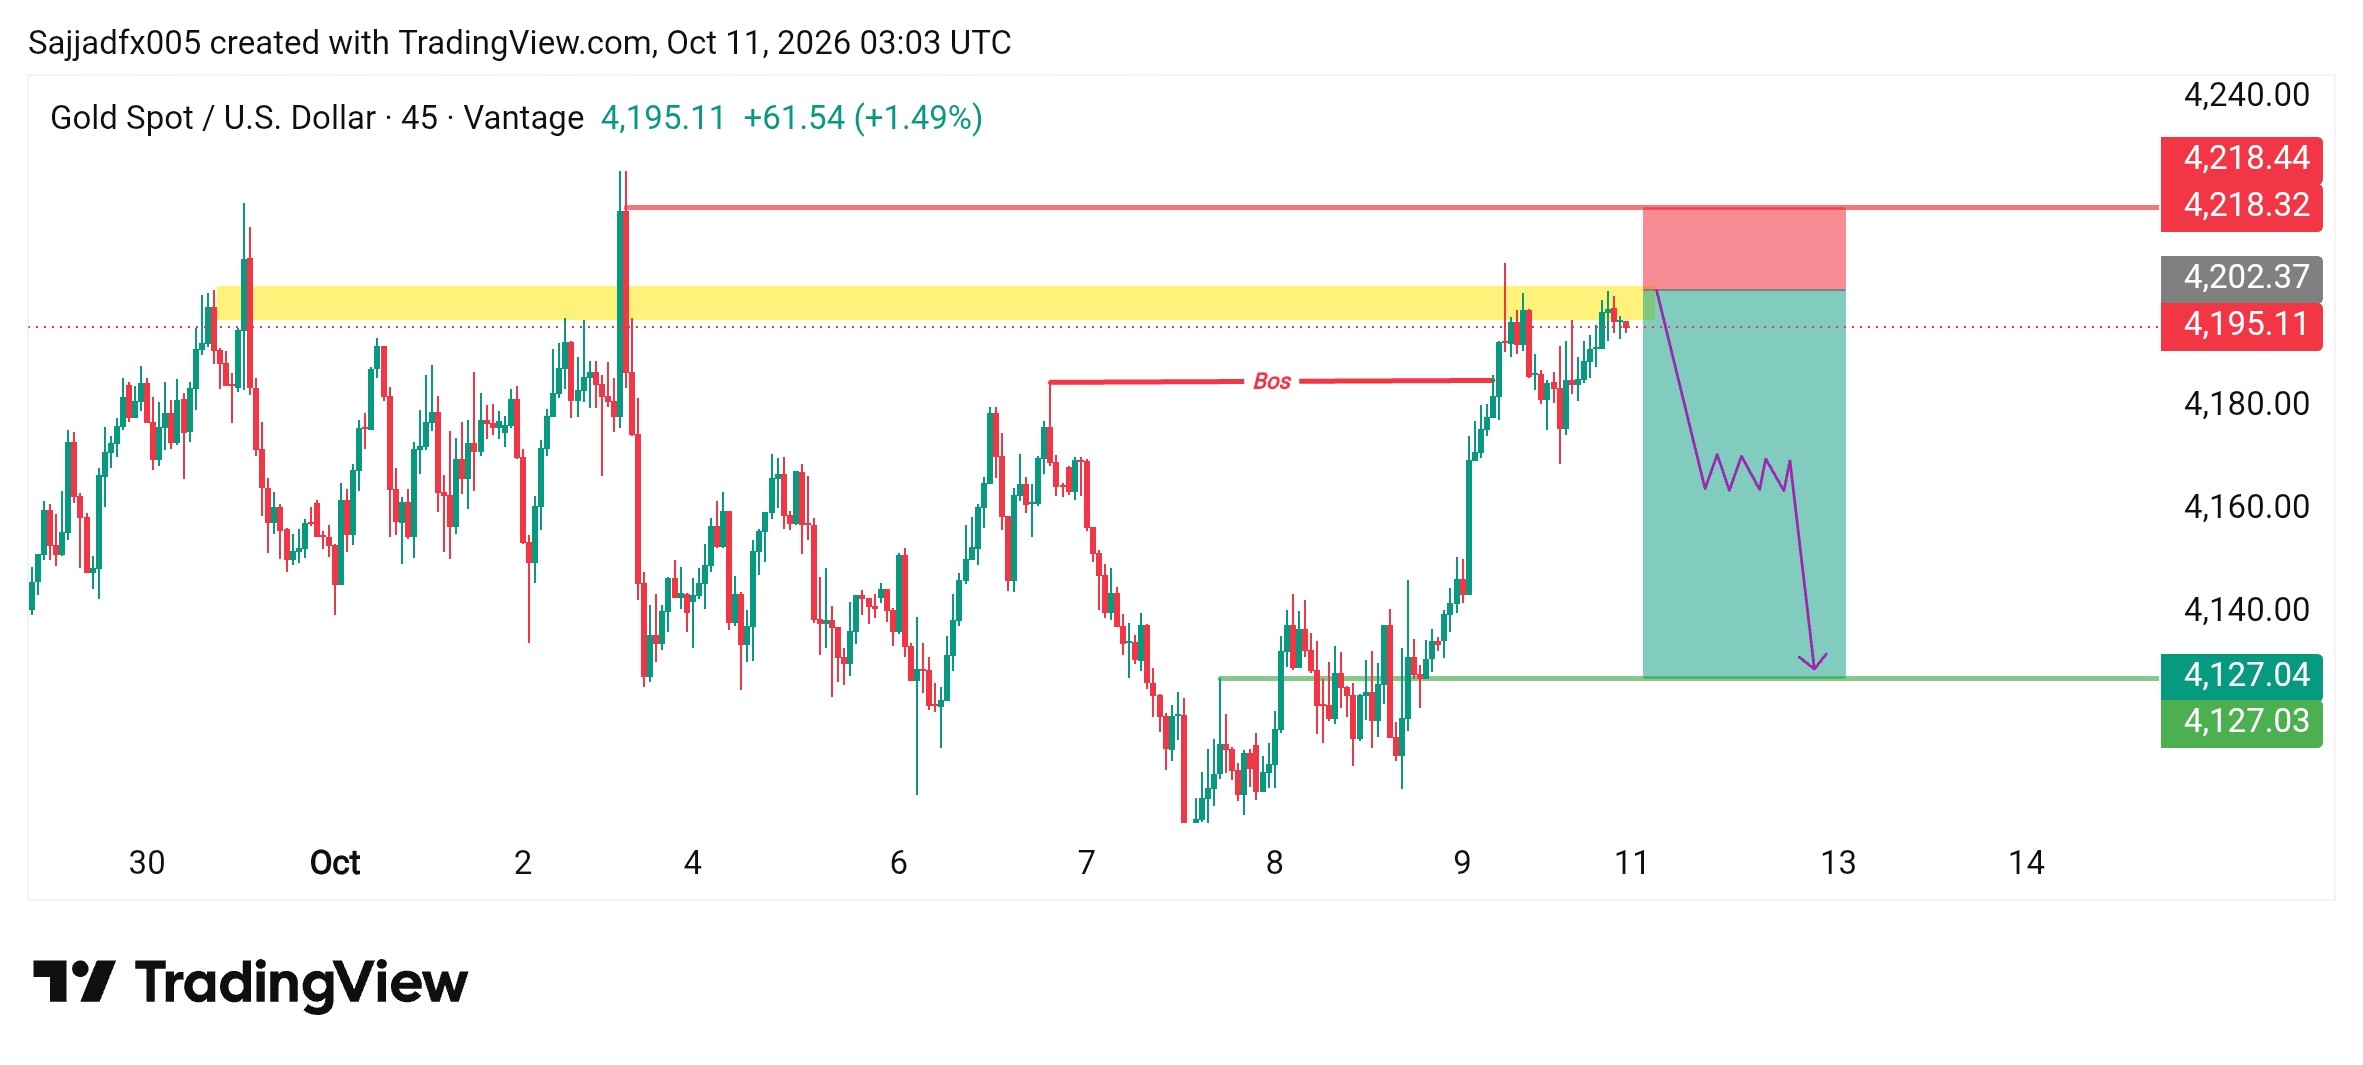
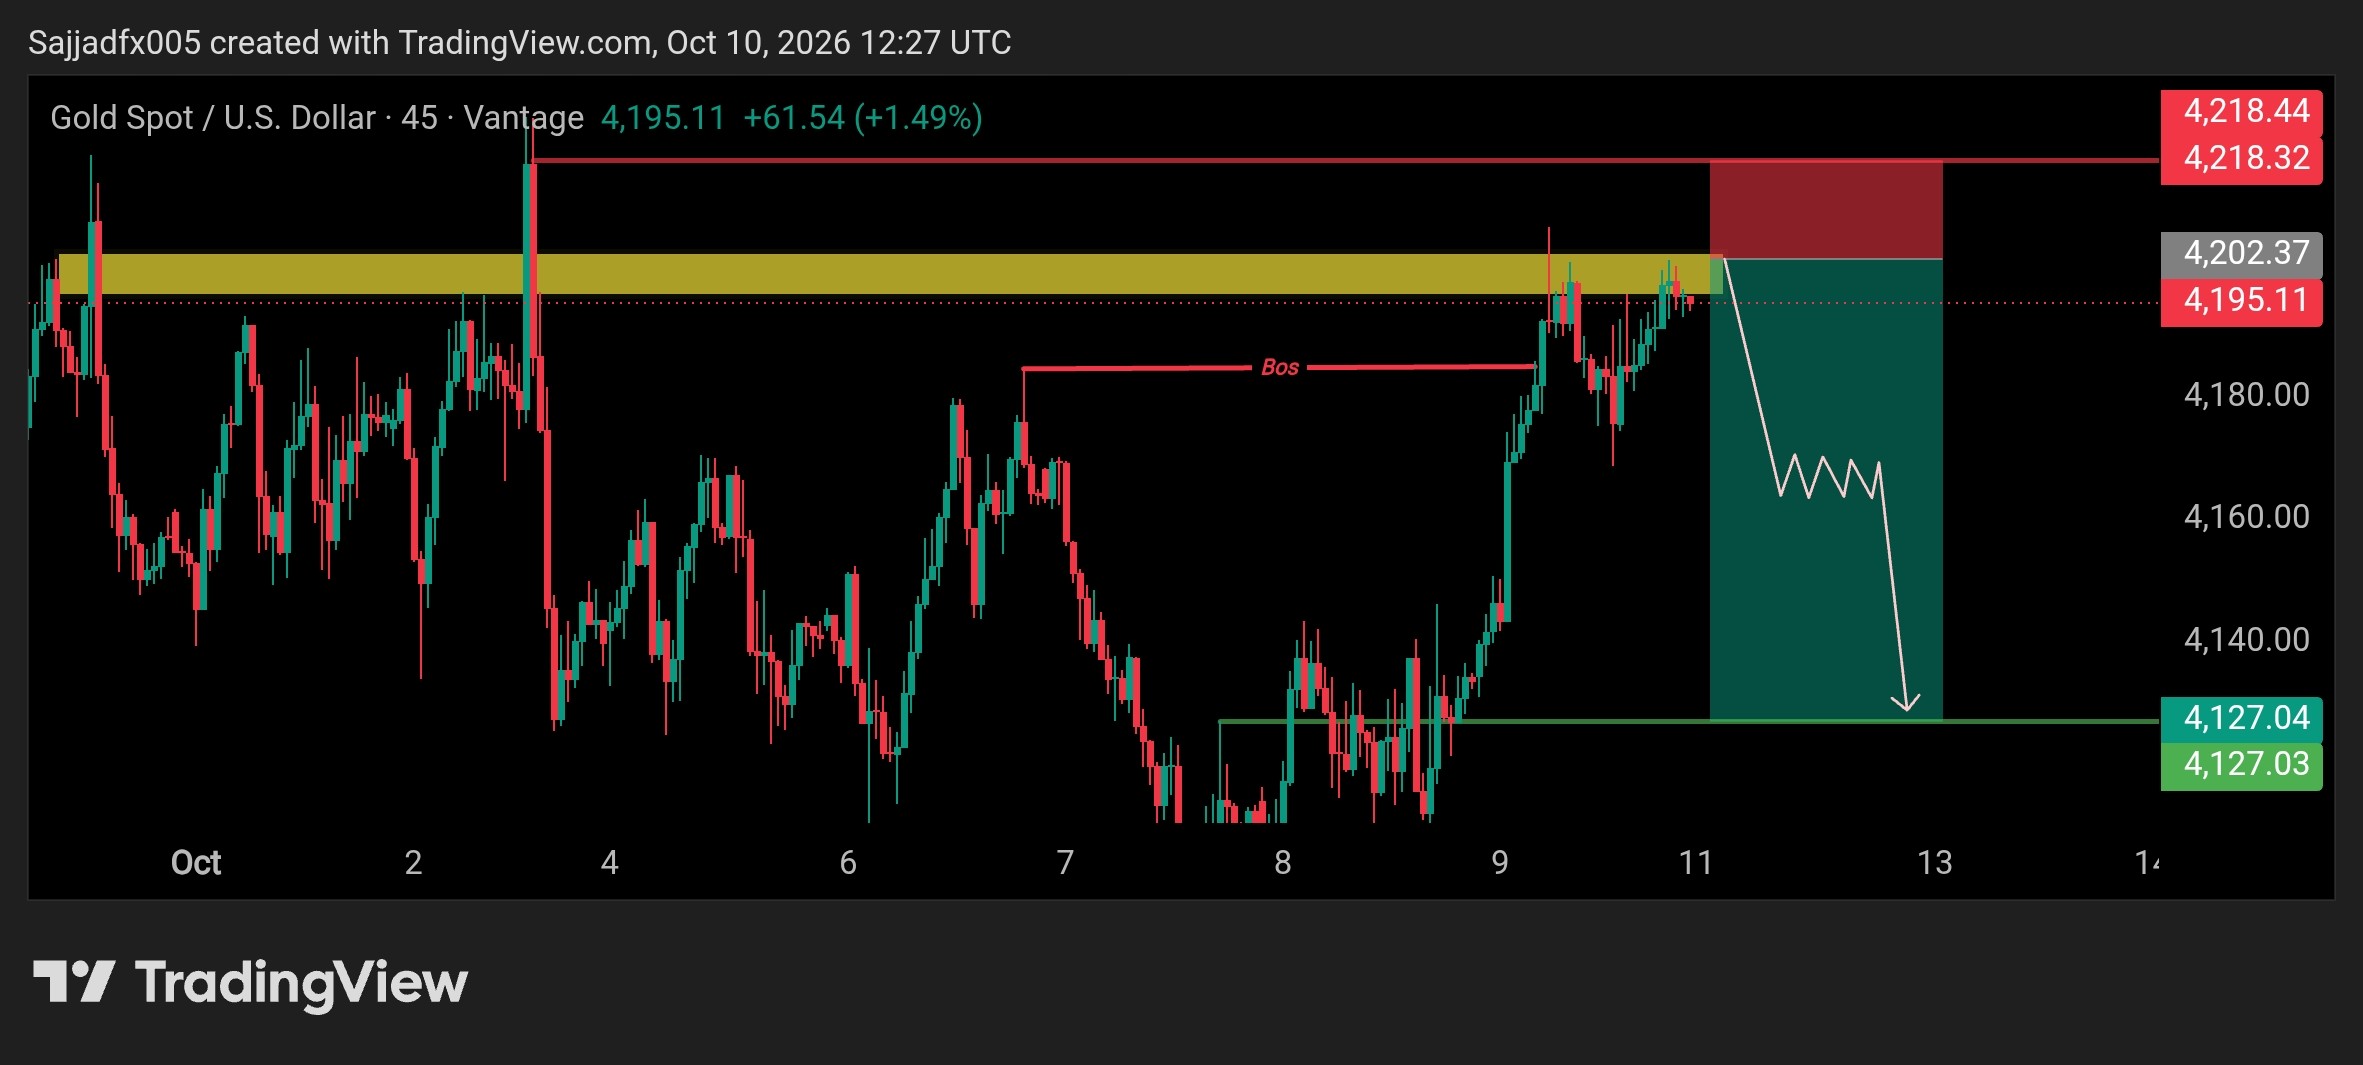
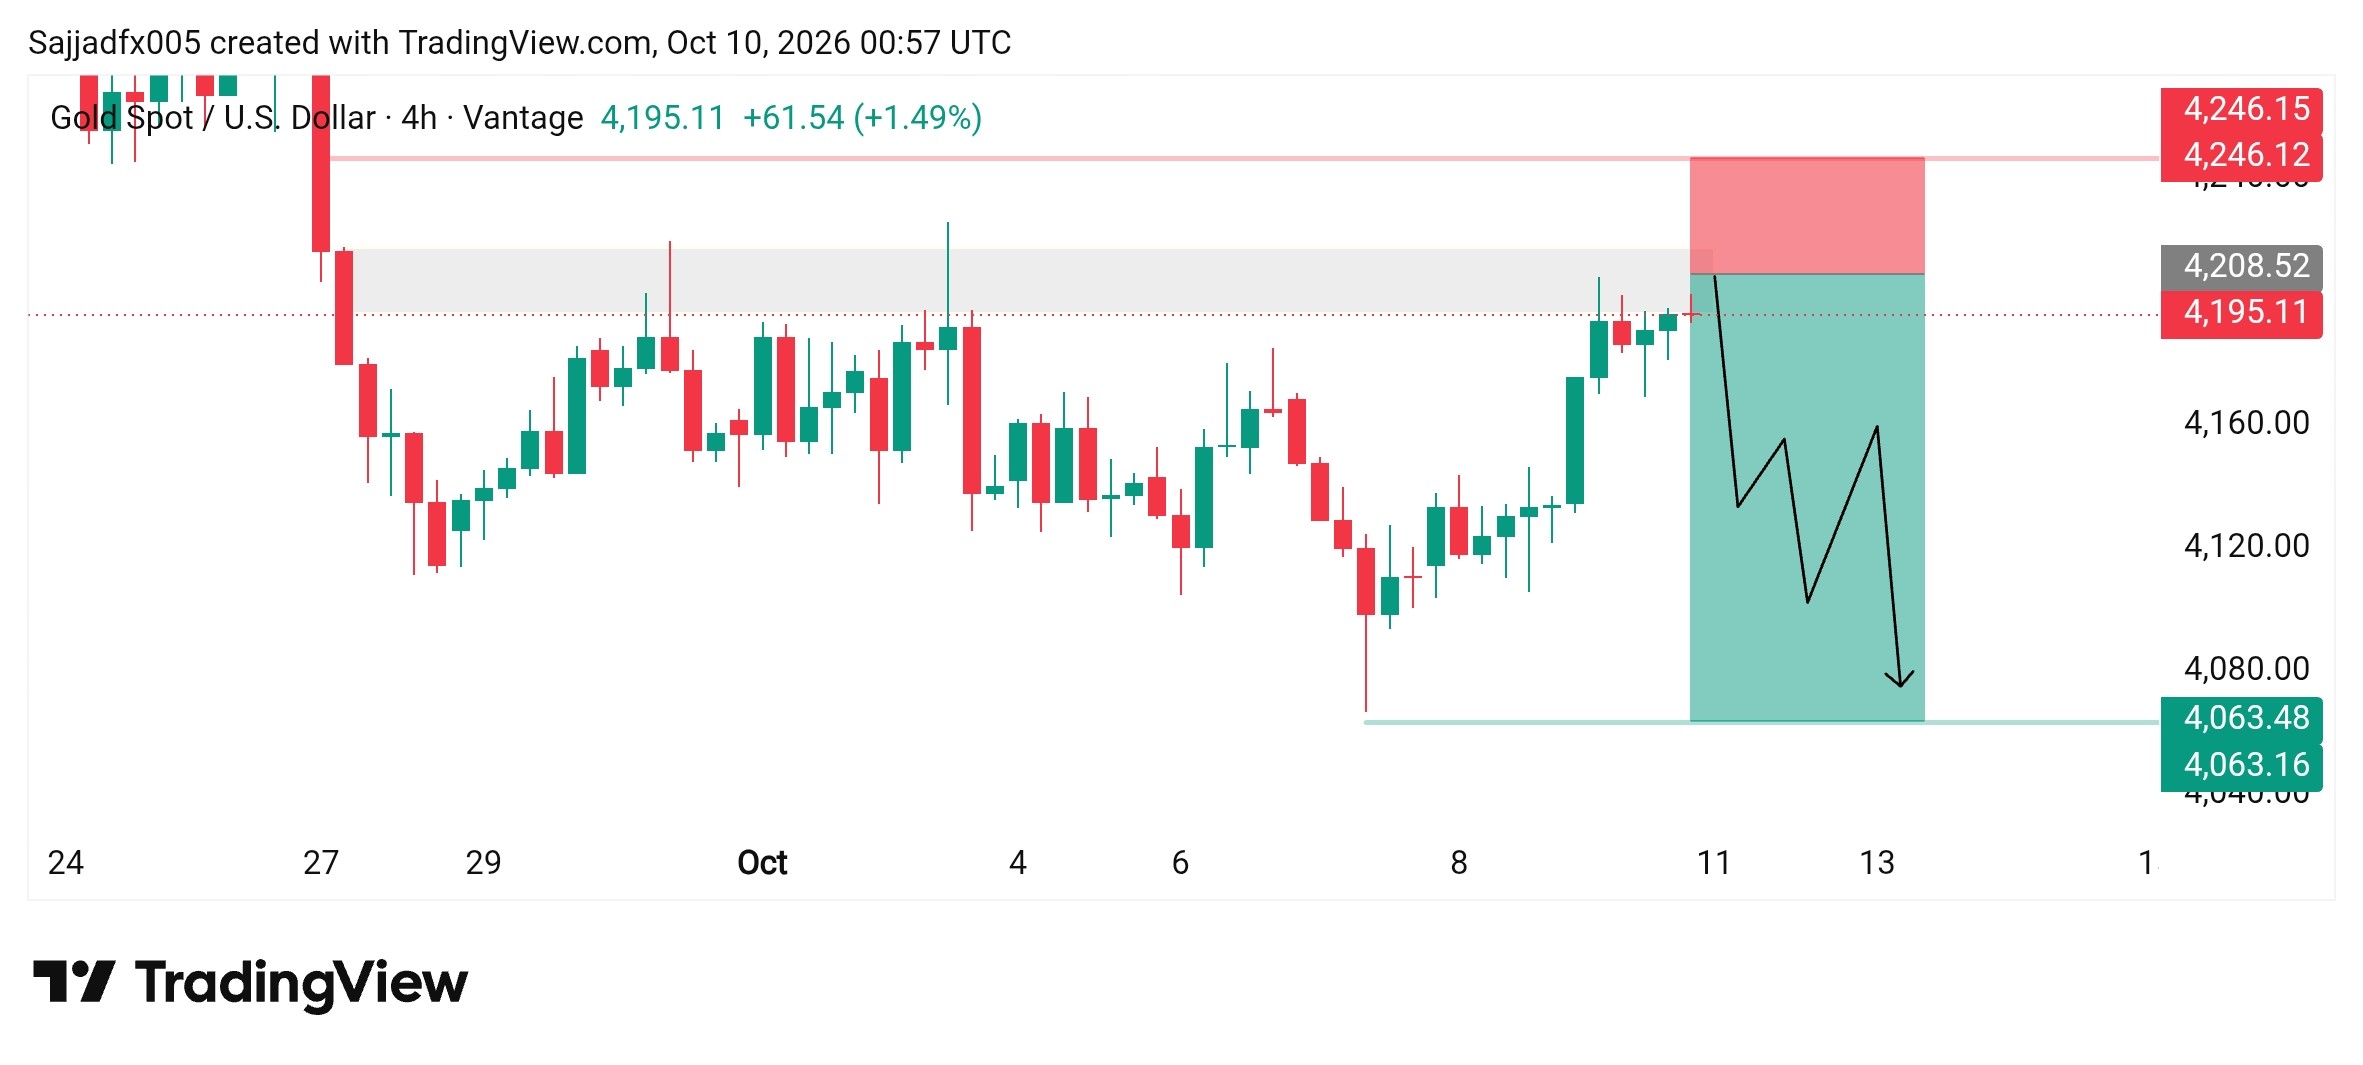
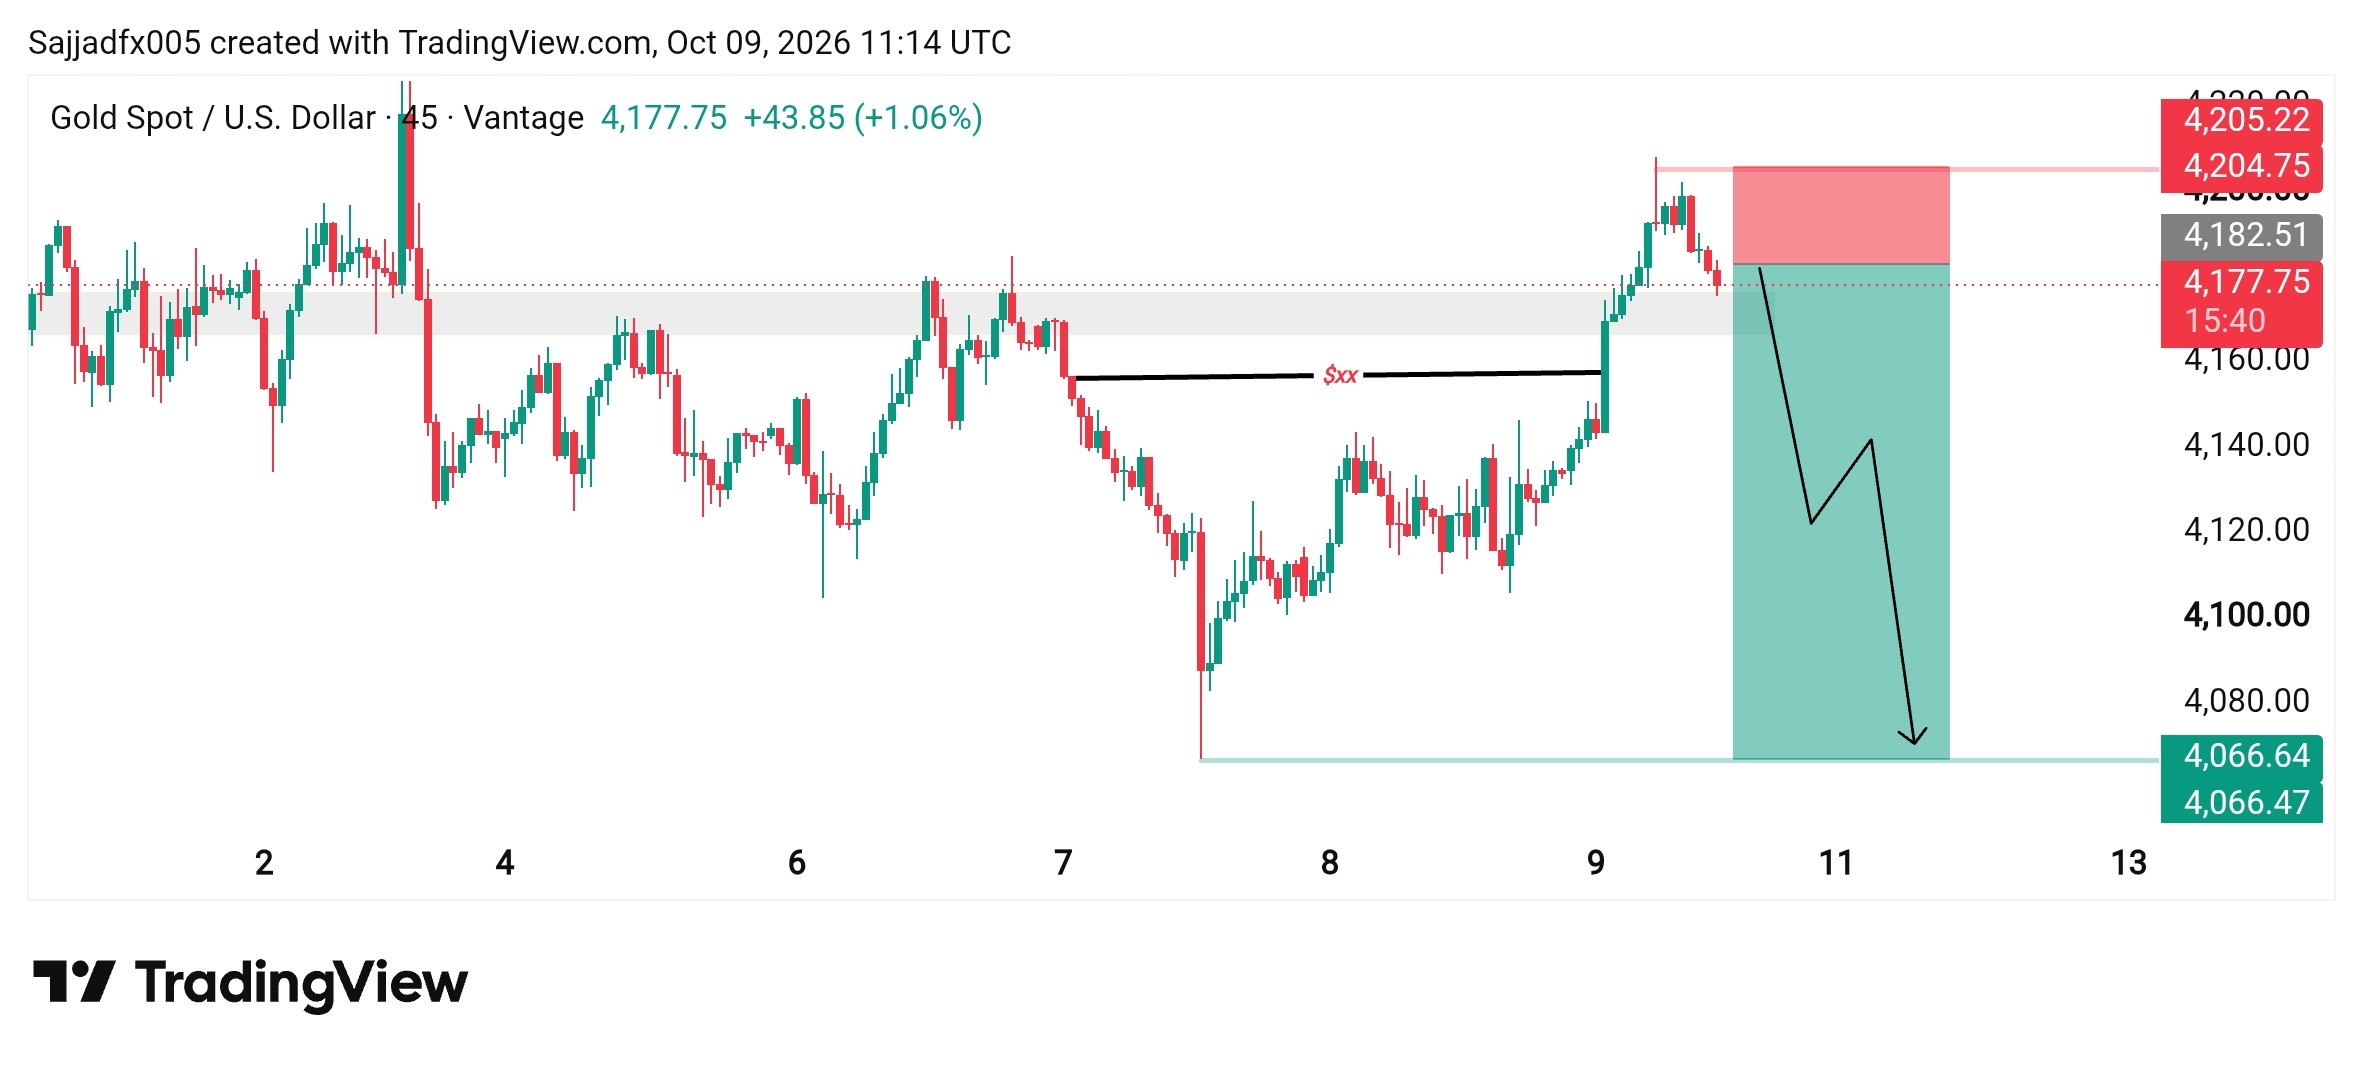
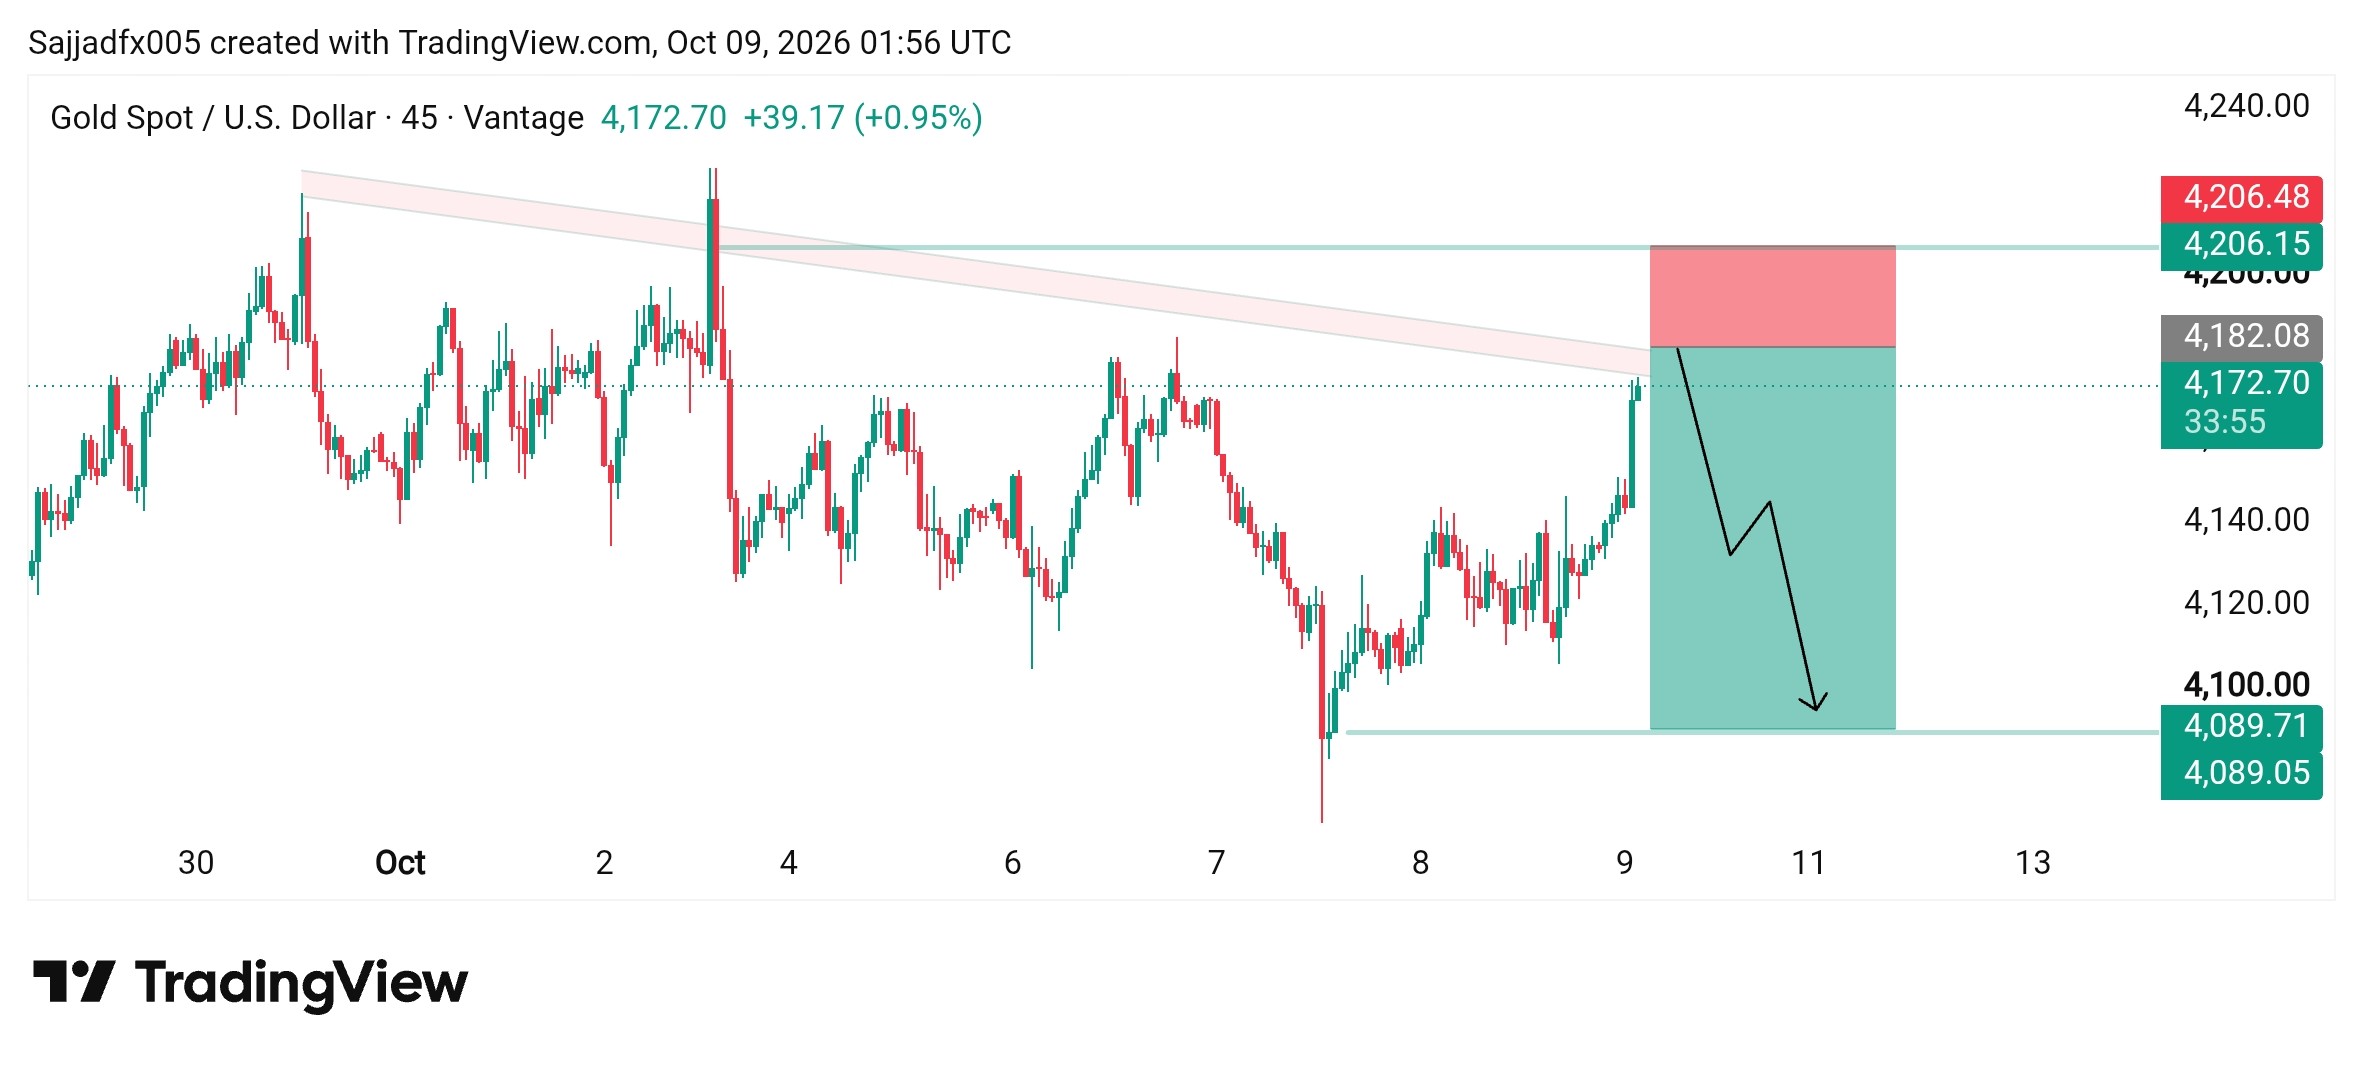
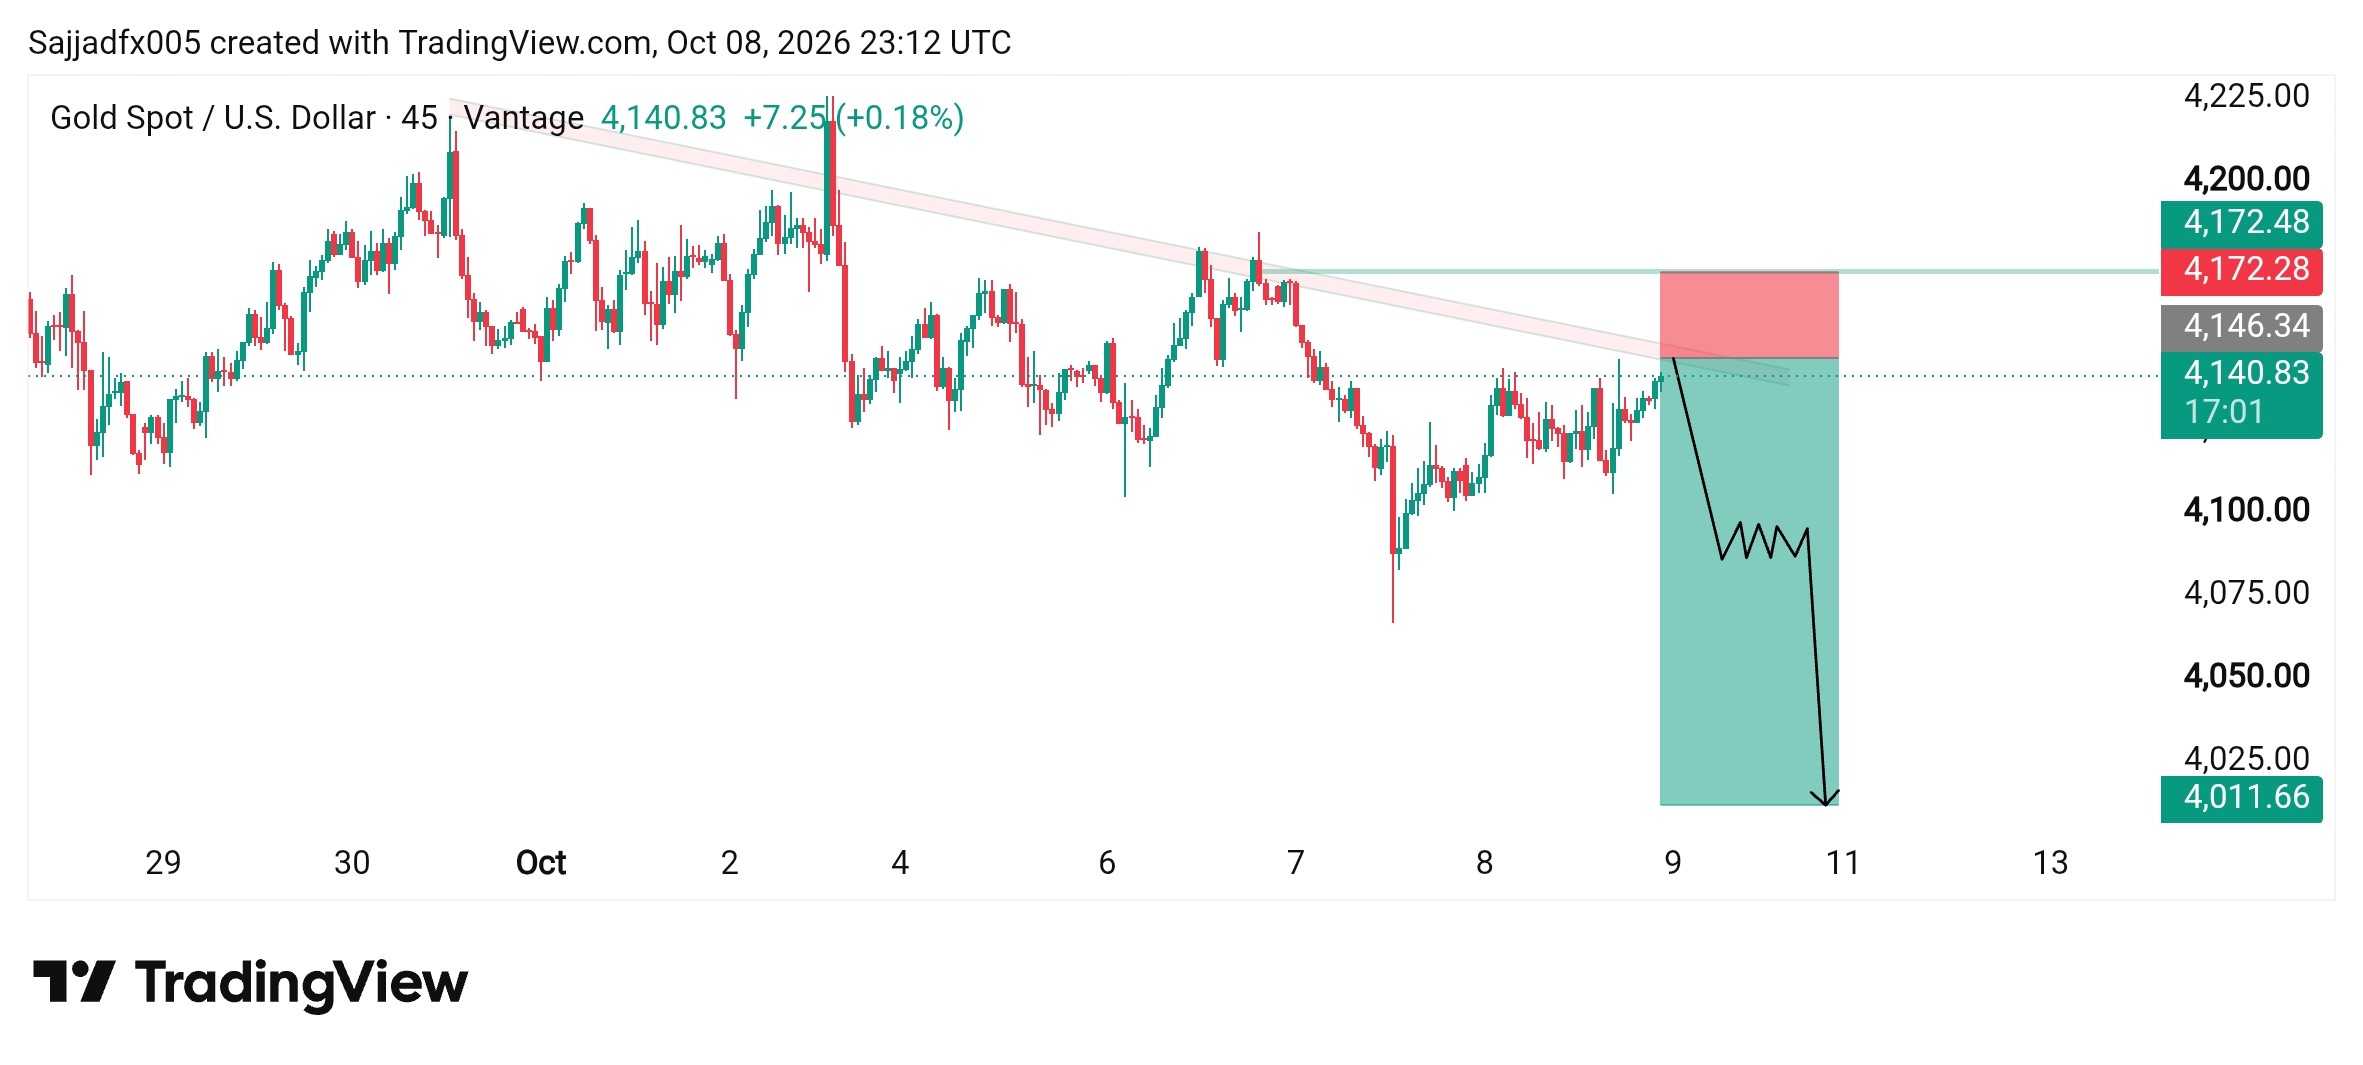
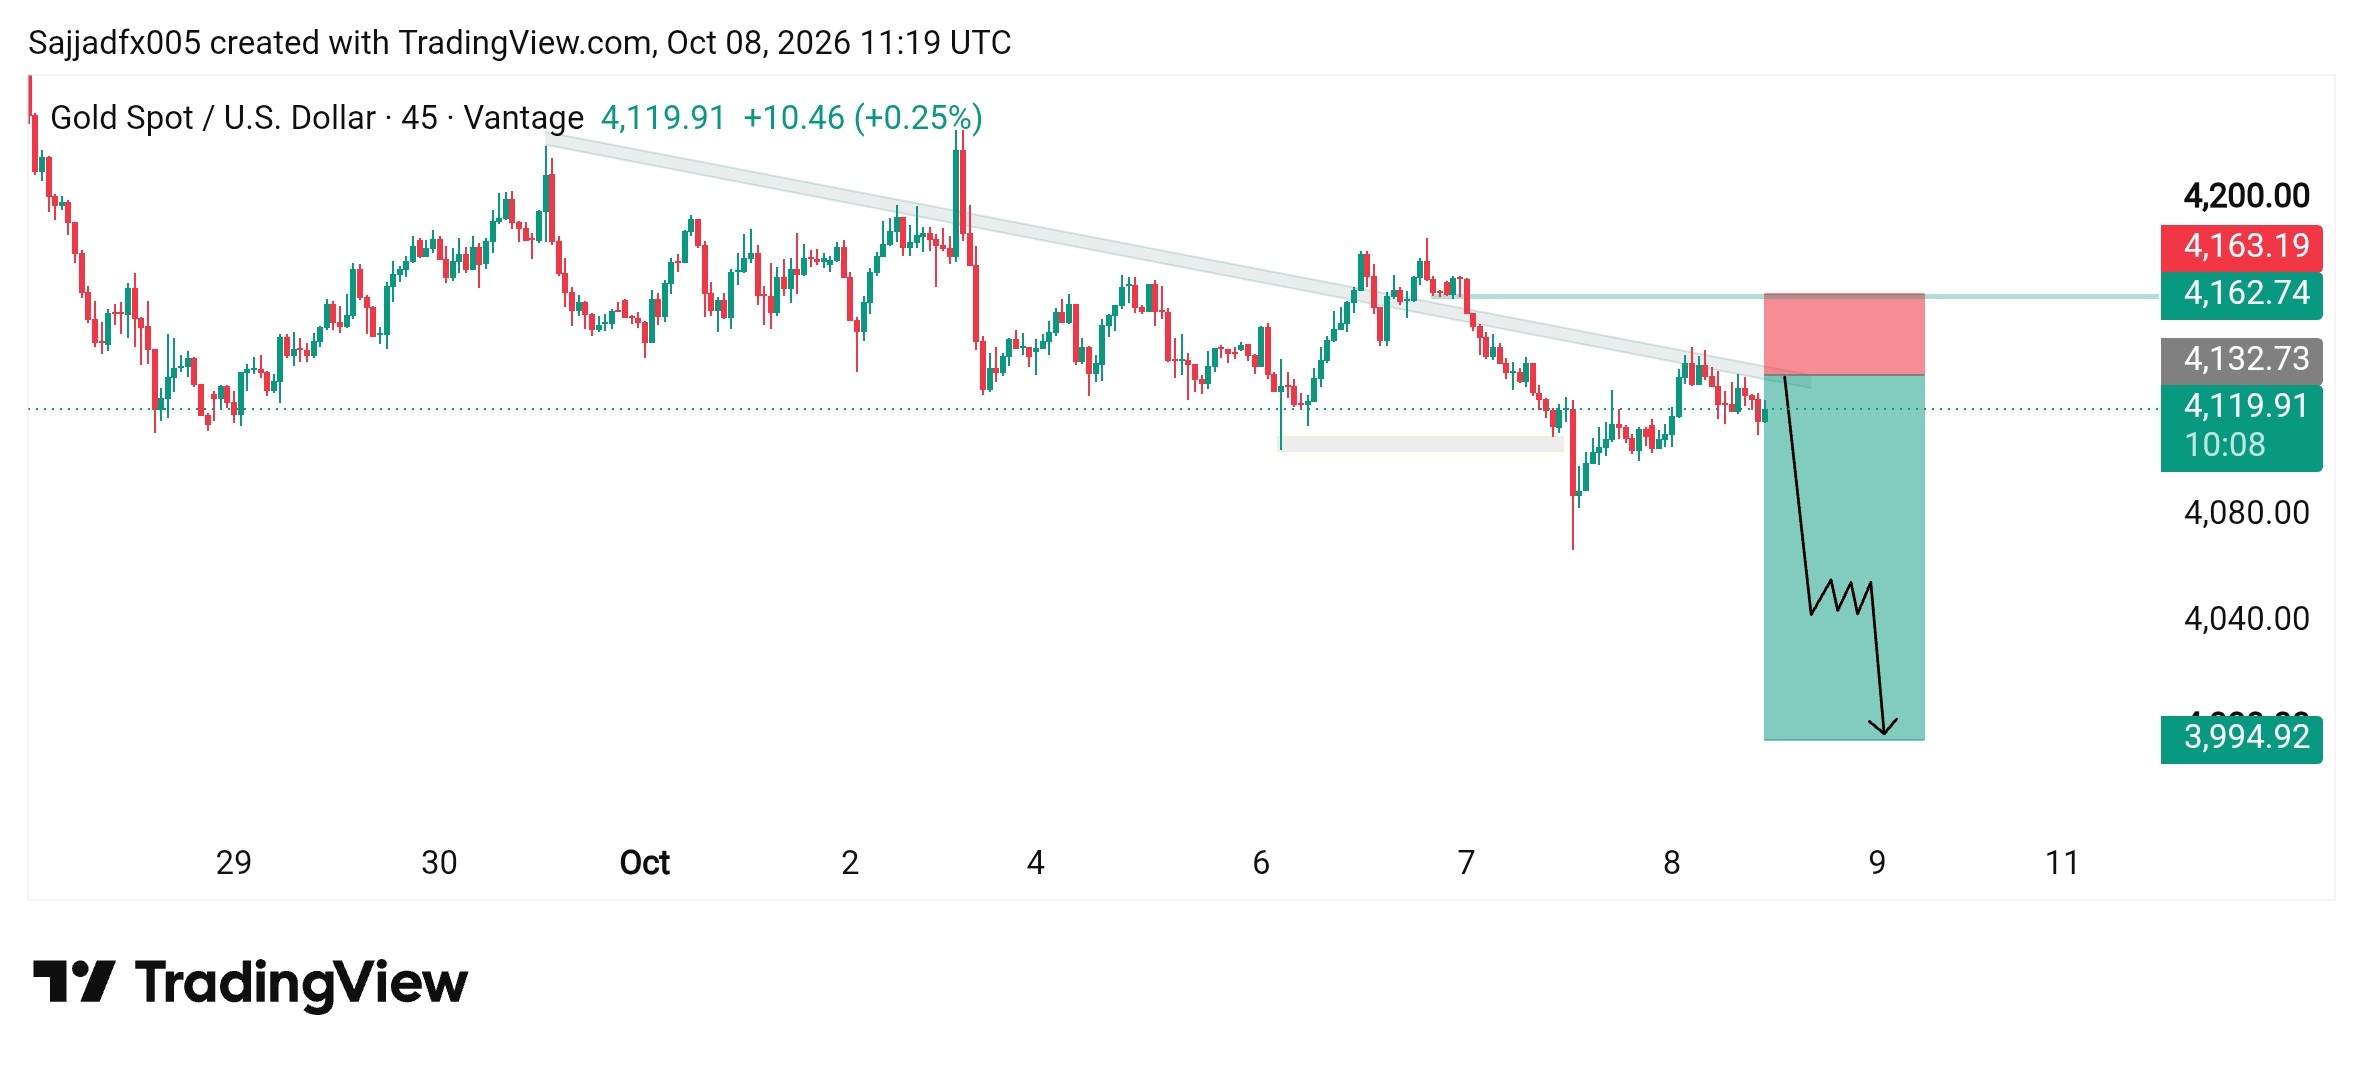
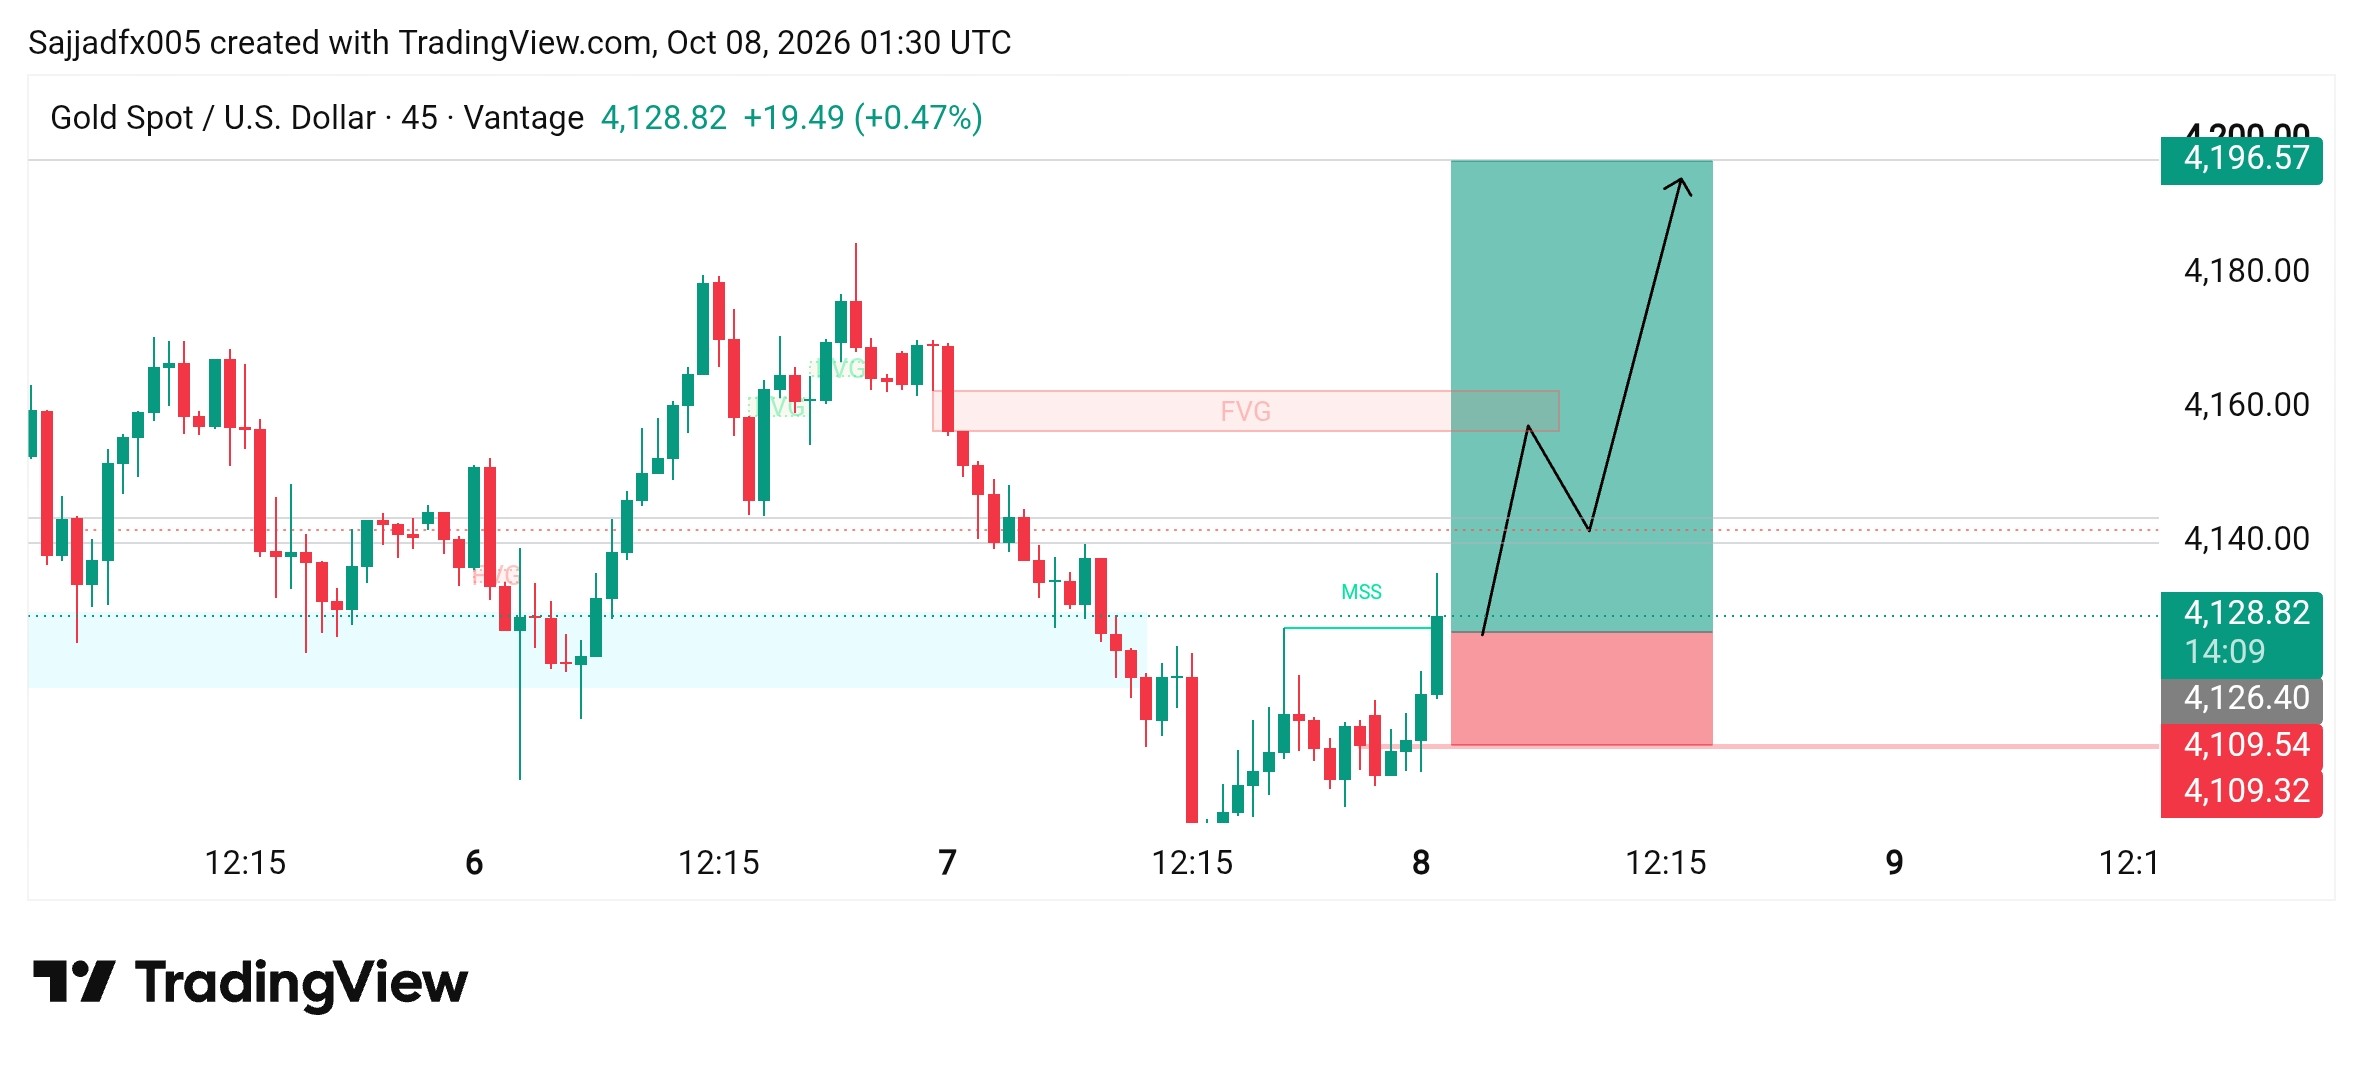
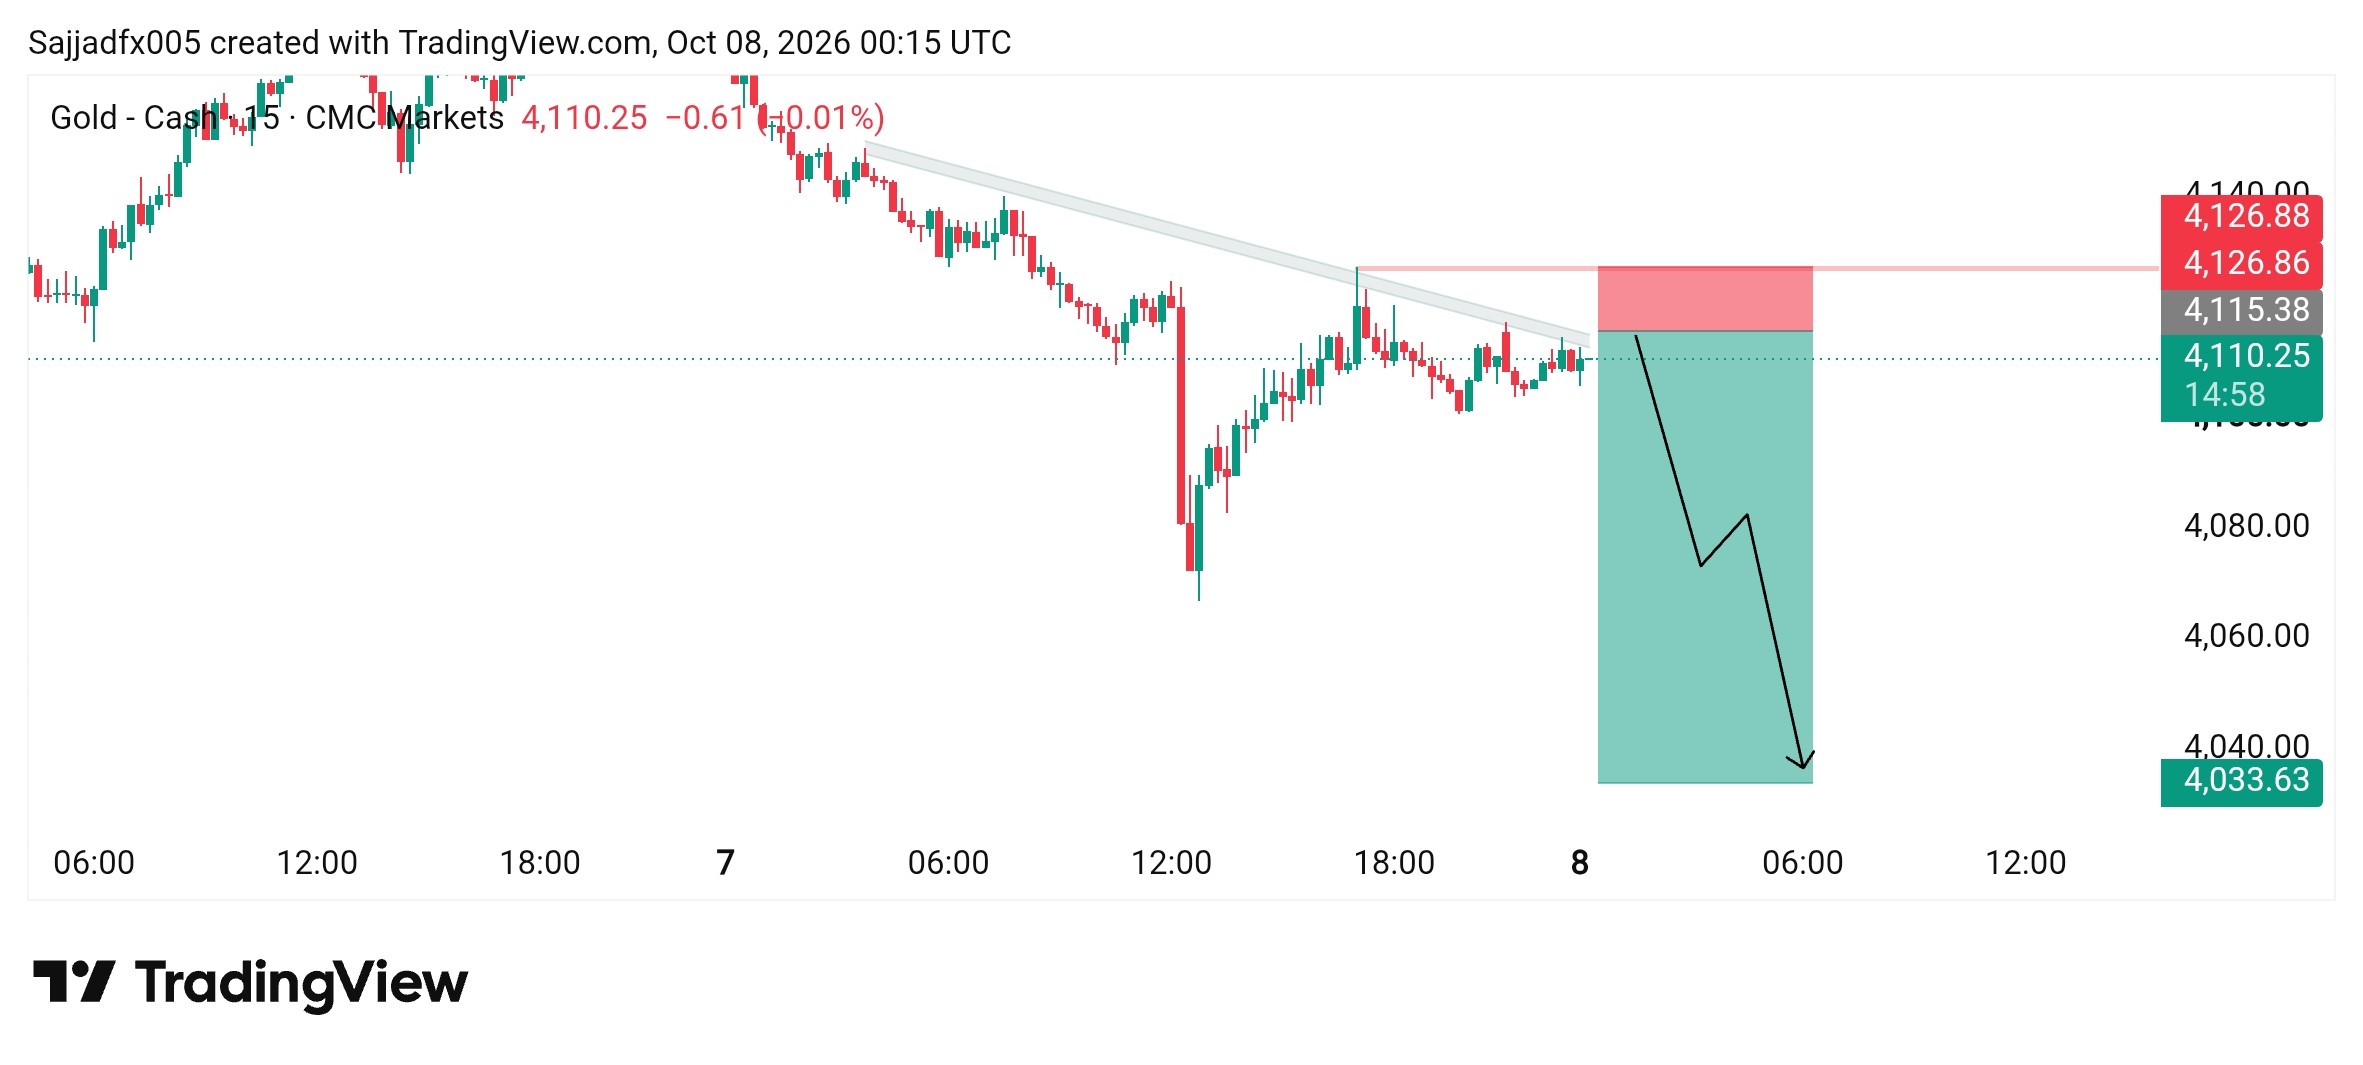
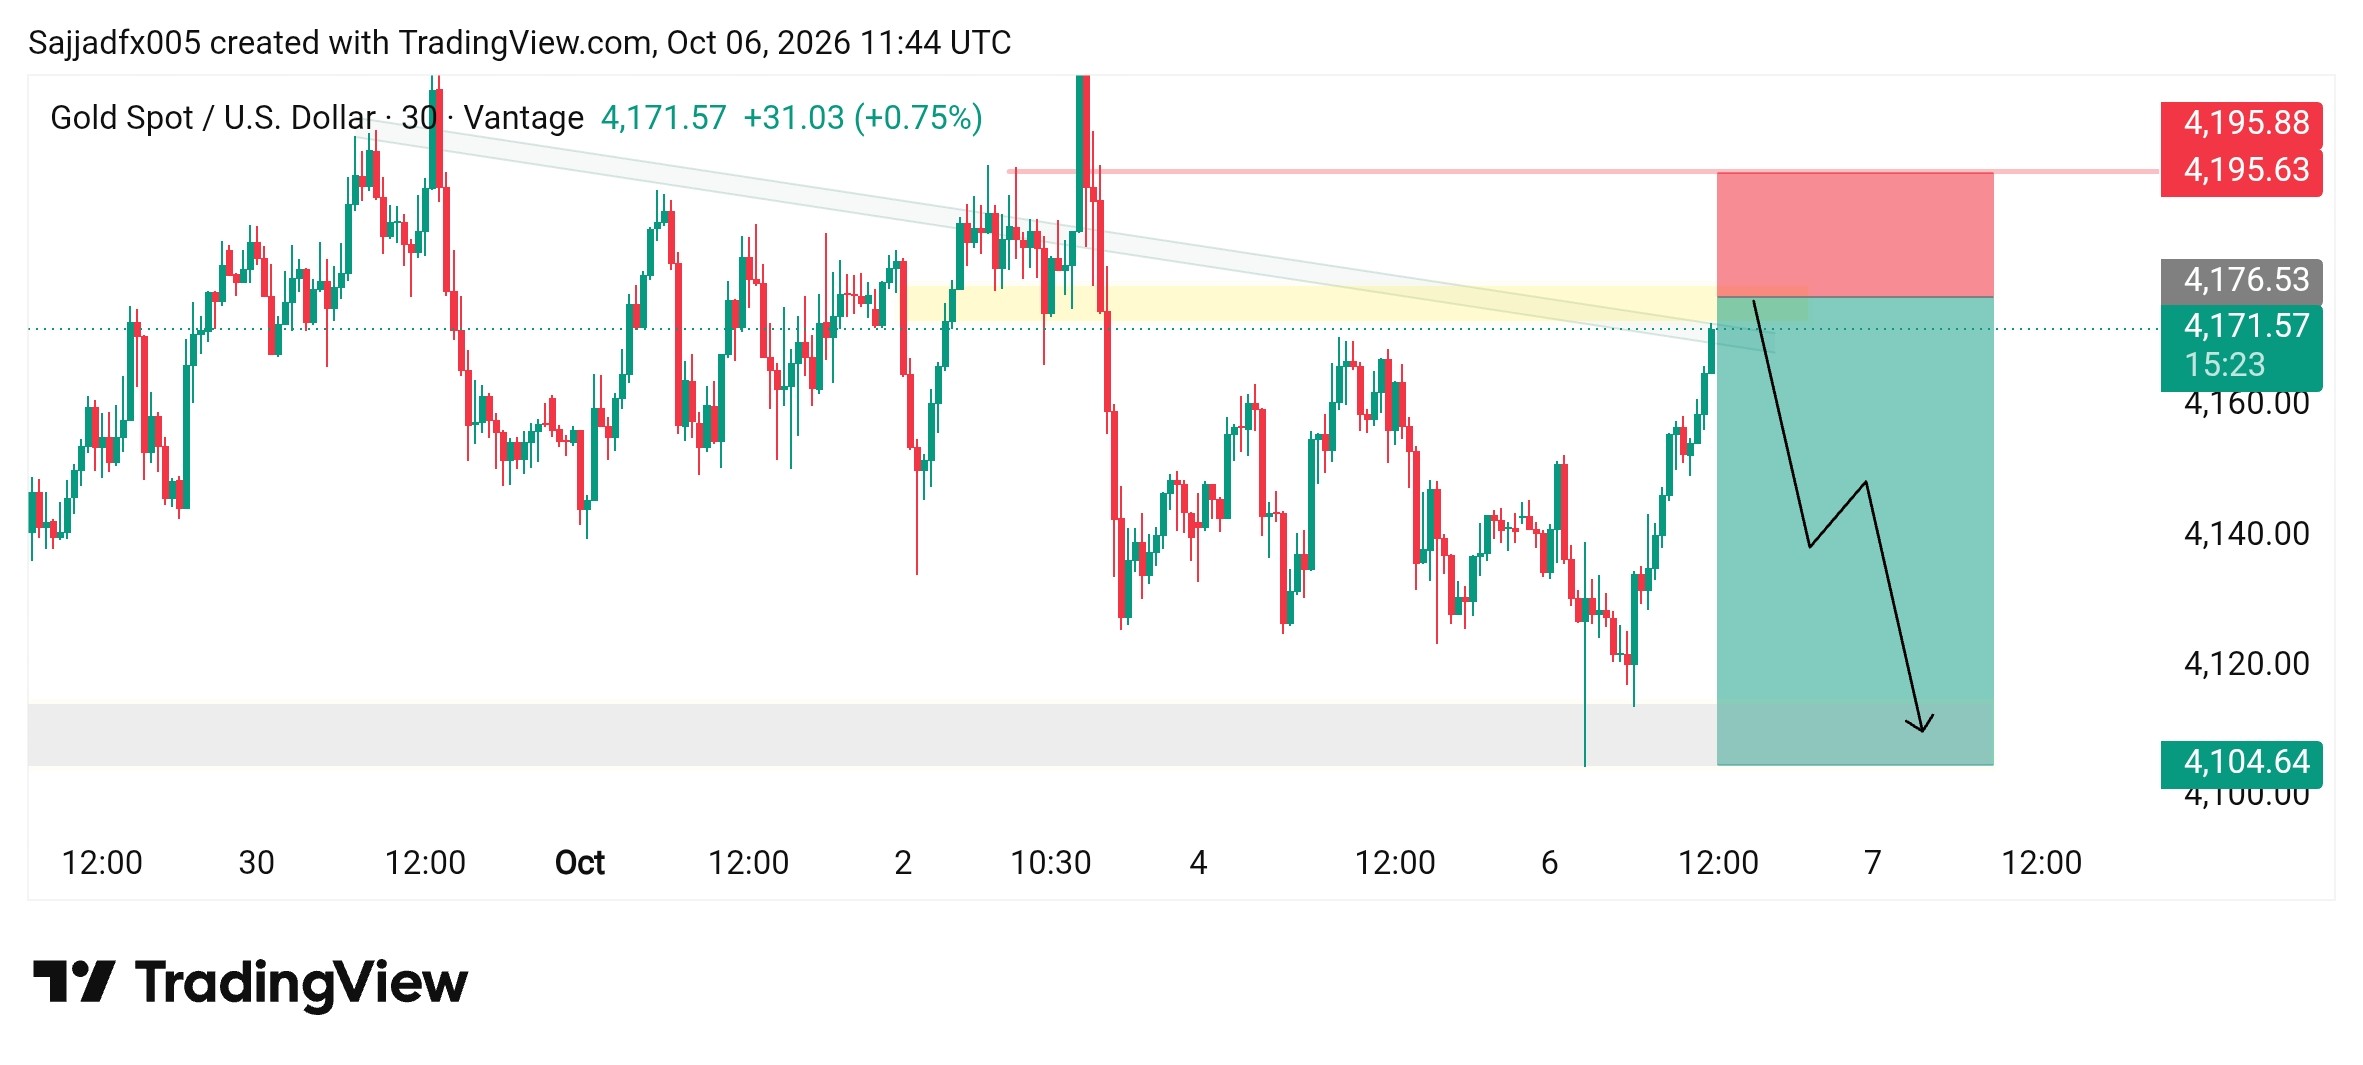
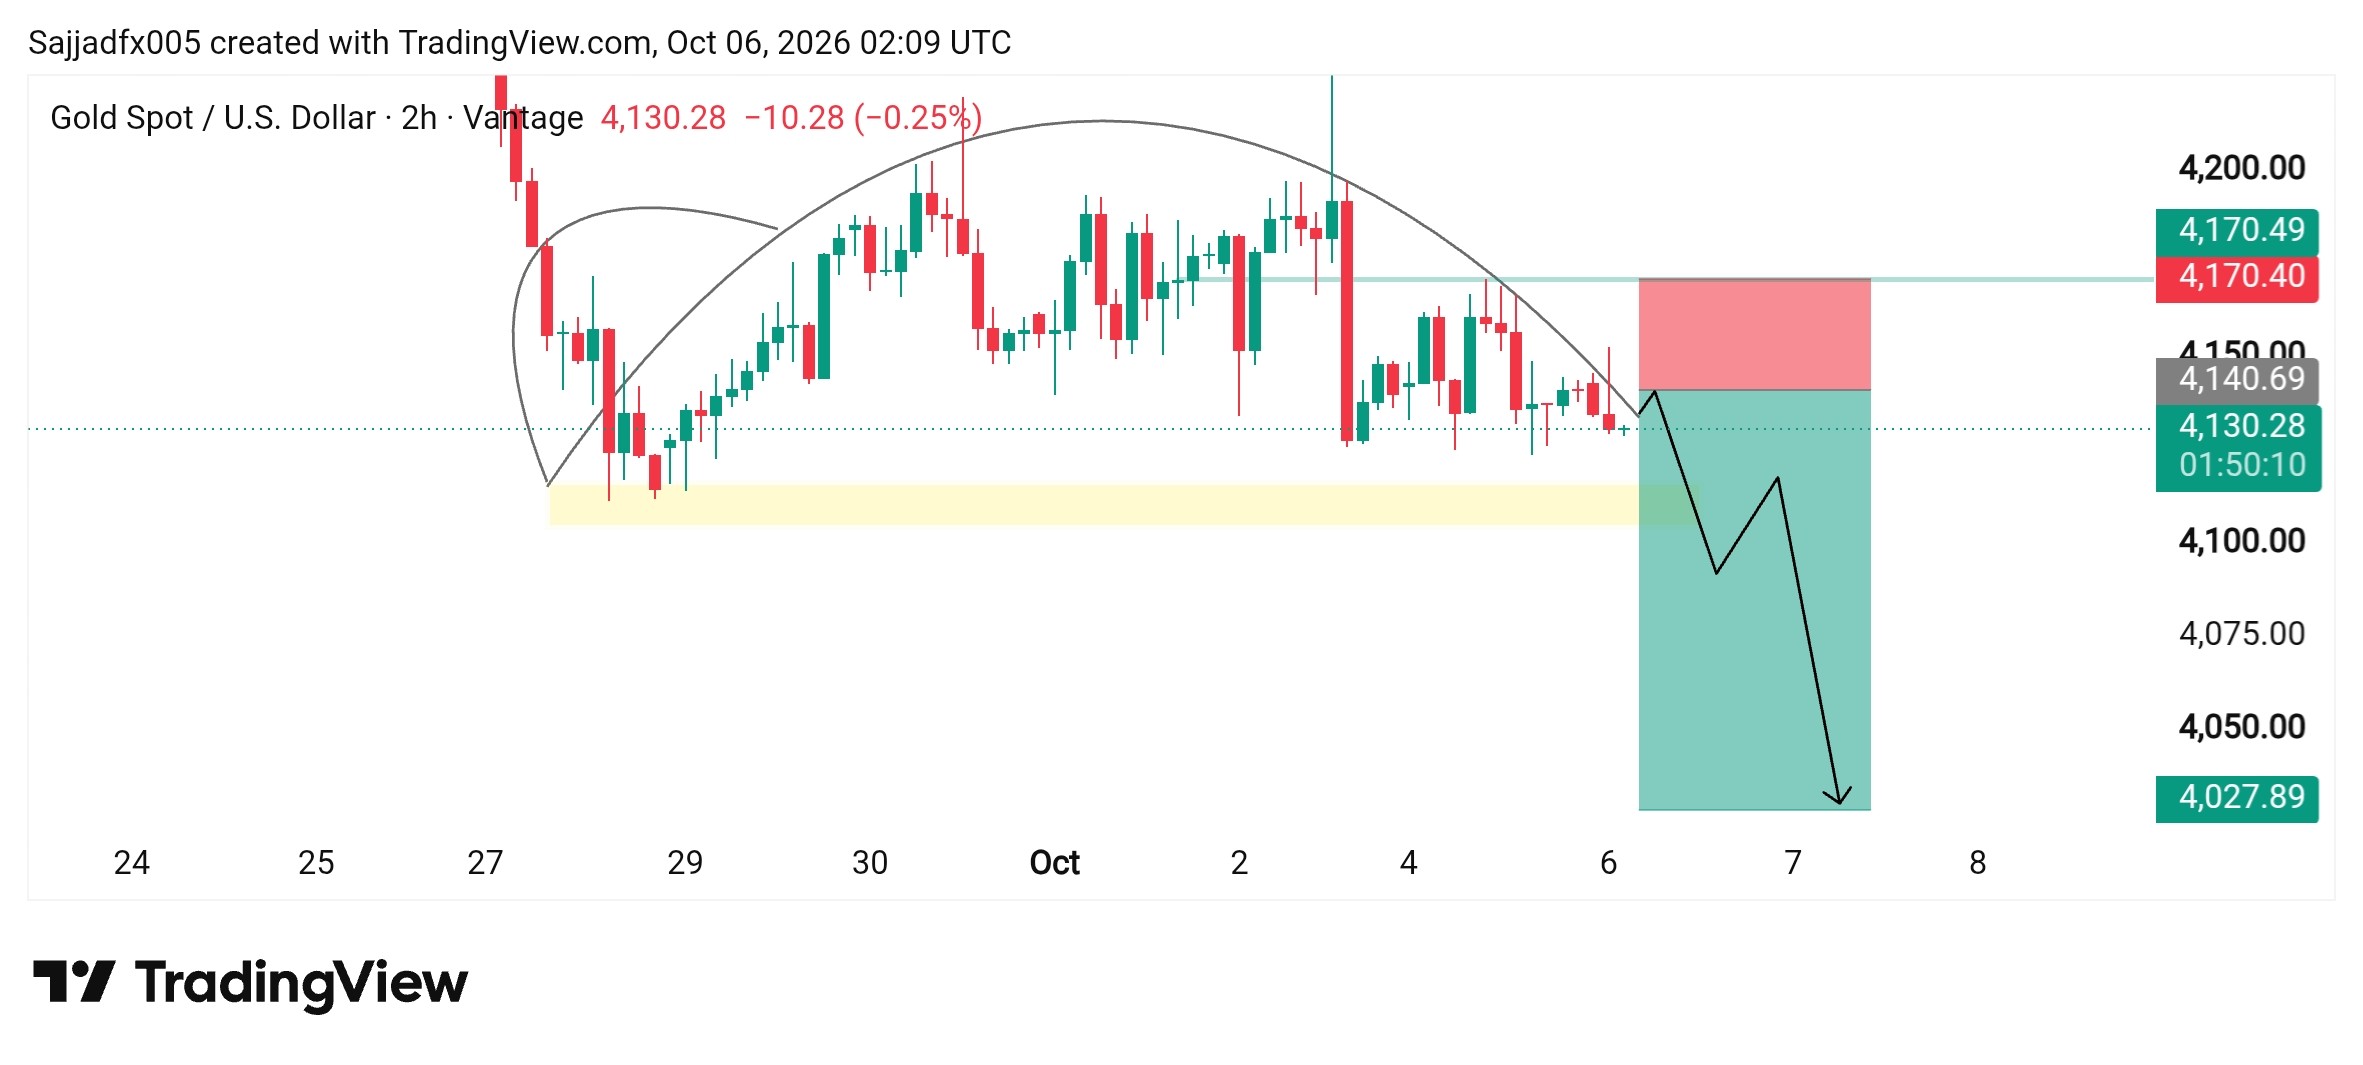
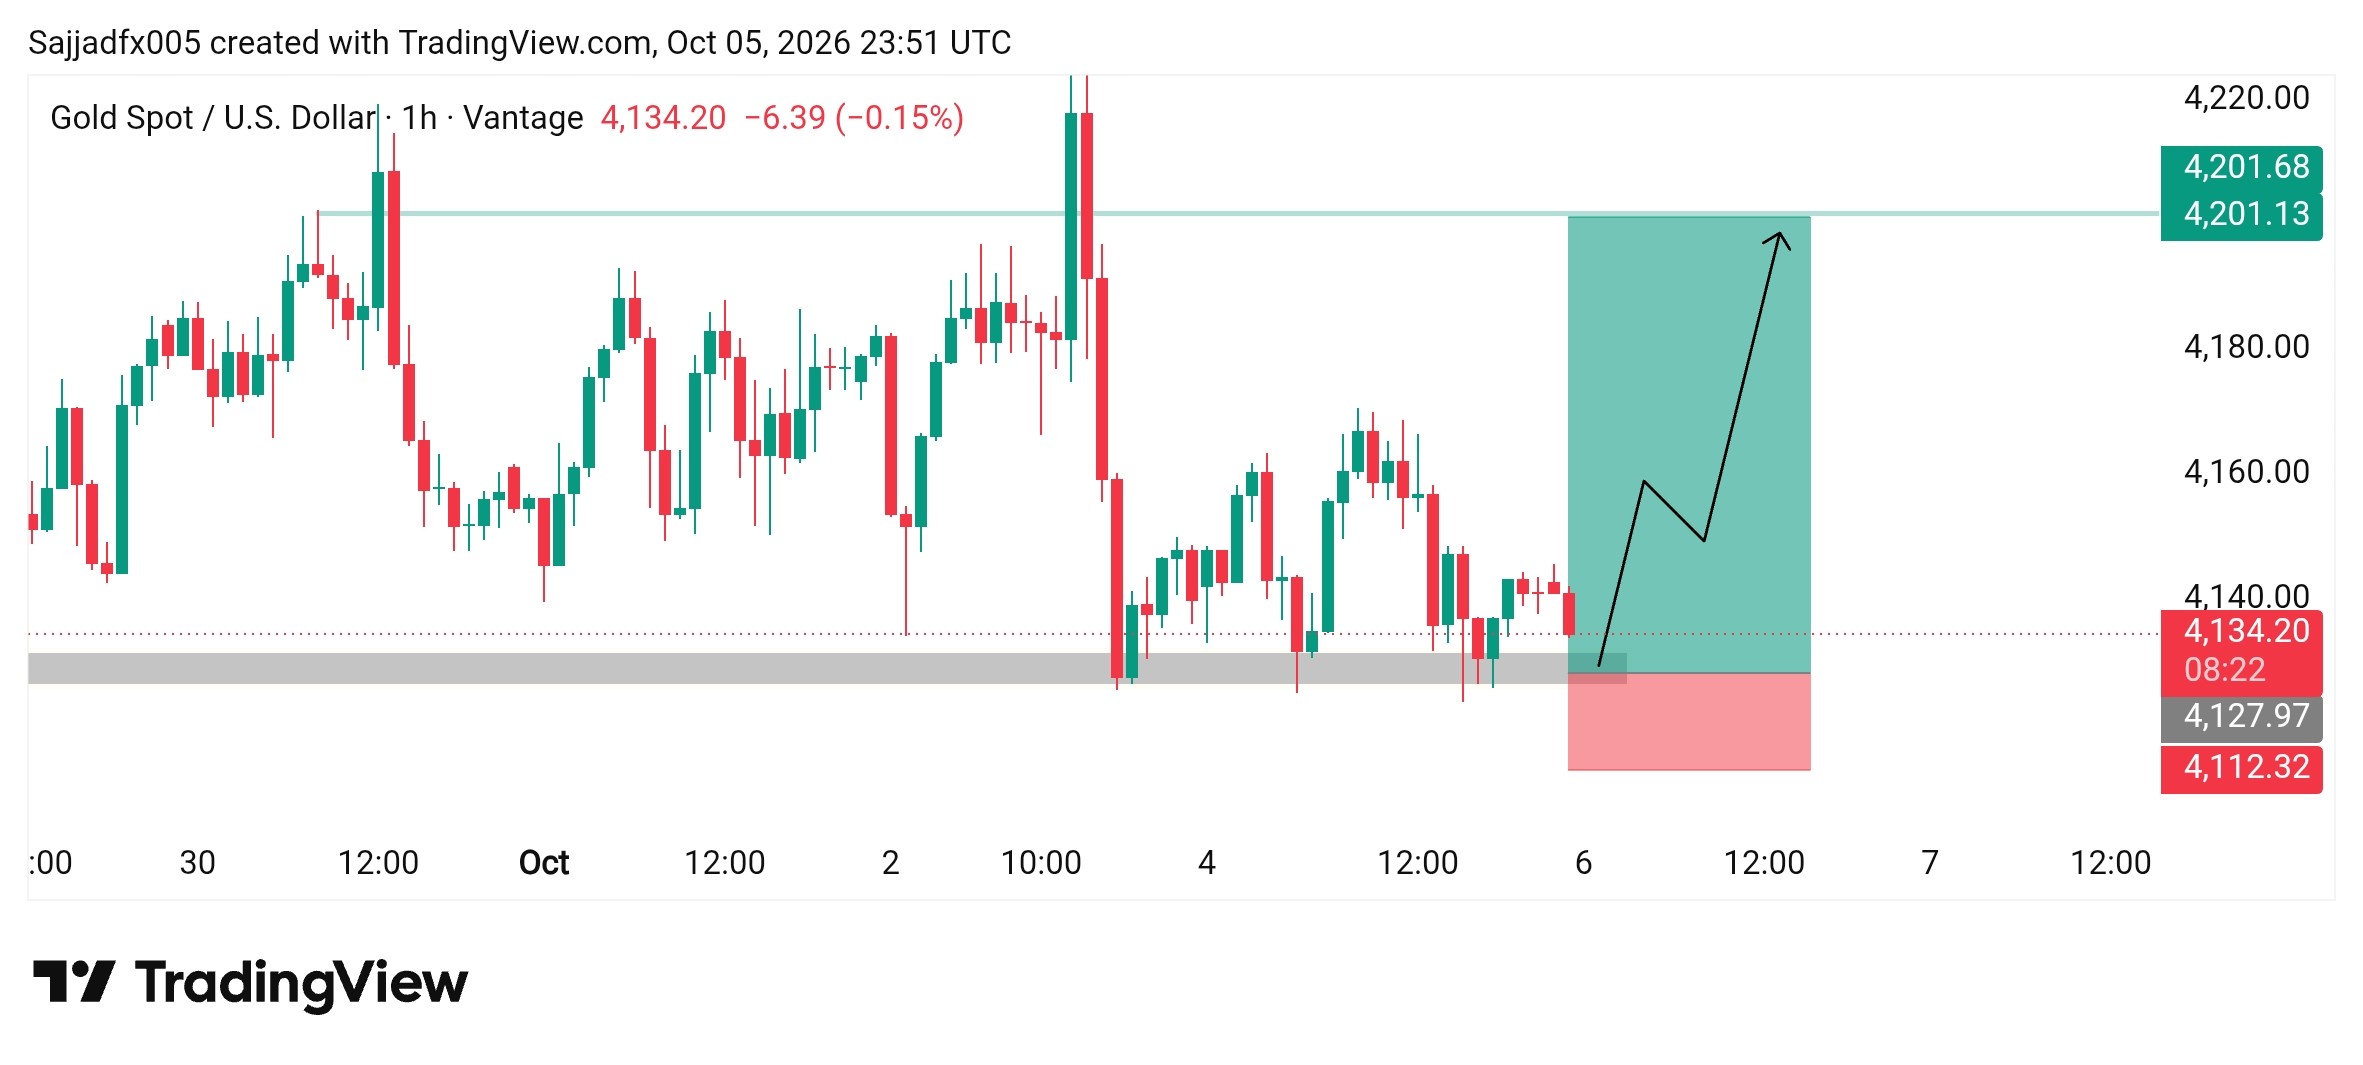
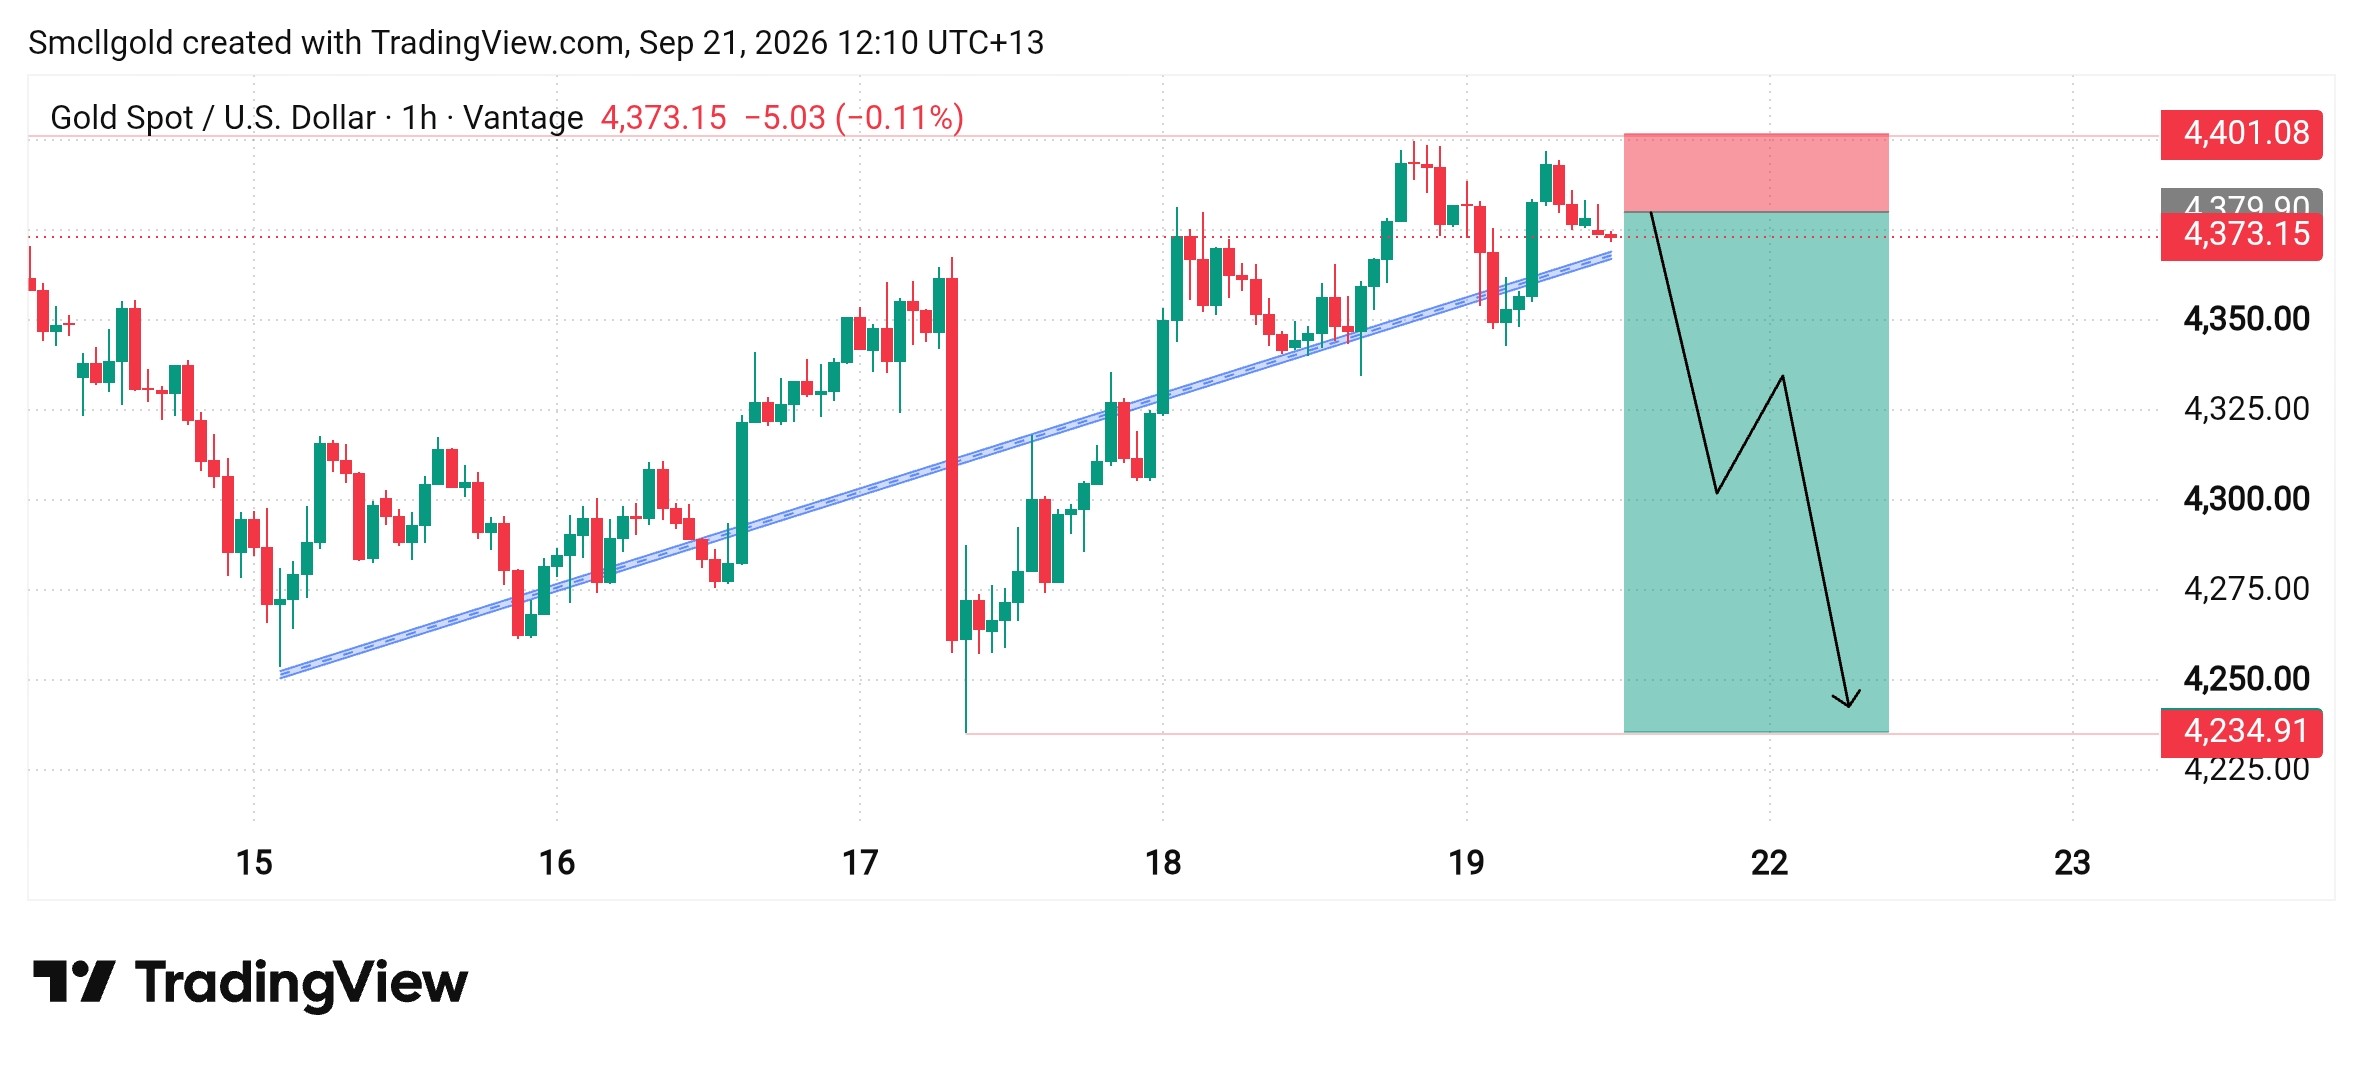
This is a financial chart focused on Gold Spot / U.S. Dollar. It displays candlestick patterns and trend lines, with a projected downward movement indicated by a black line and a shaded green area. The mood is analytical and data-driven, typical of trading platforms. Visually notable are the red and green candlesticks representing price changes, the blue trend line, and the projected trade entry and exit points marked by colored rectangles. ON-SCREEN TEXT: Smcllgold created with TradingView.com, Sep 21, 2026 12:10 UTC+13 Gold Spot / U.S. Dollar · 1h · Vantage 4,373.15 -5.03 (-0.11%) 4,401.08 4,379.90 4,373.15 4,350.00 4,325.00 4,300.00 4,275.00
?