
iFANN
    iFANN 검색...
    로그인
    홈
    뉴스
    동영상
    북
    사진
    GIF
    탐색
    투표
    어워드
    iFAMOUS
    위키
    애니
    룸
    알림
    메시지
    북마크
    프로필
    위키어워드iFAMOUS랭킹산업크리에이터 리워드사용자 리워드약관개인정보커뮤니티 가이드라인게시 중단 / DMCA도움말개발자

    © 2026 iFANN

    홈
    검색
    메시지
    알림
    프로필
    사진
    Evira
    Evira@evira3mo
    🏢Morgan Stanley💭artificial intelligence💭Finance
    IT Services vs S&P 500 decade lows

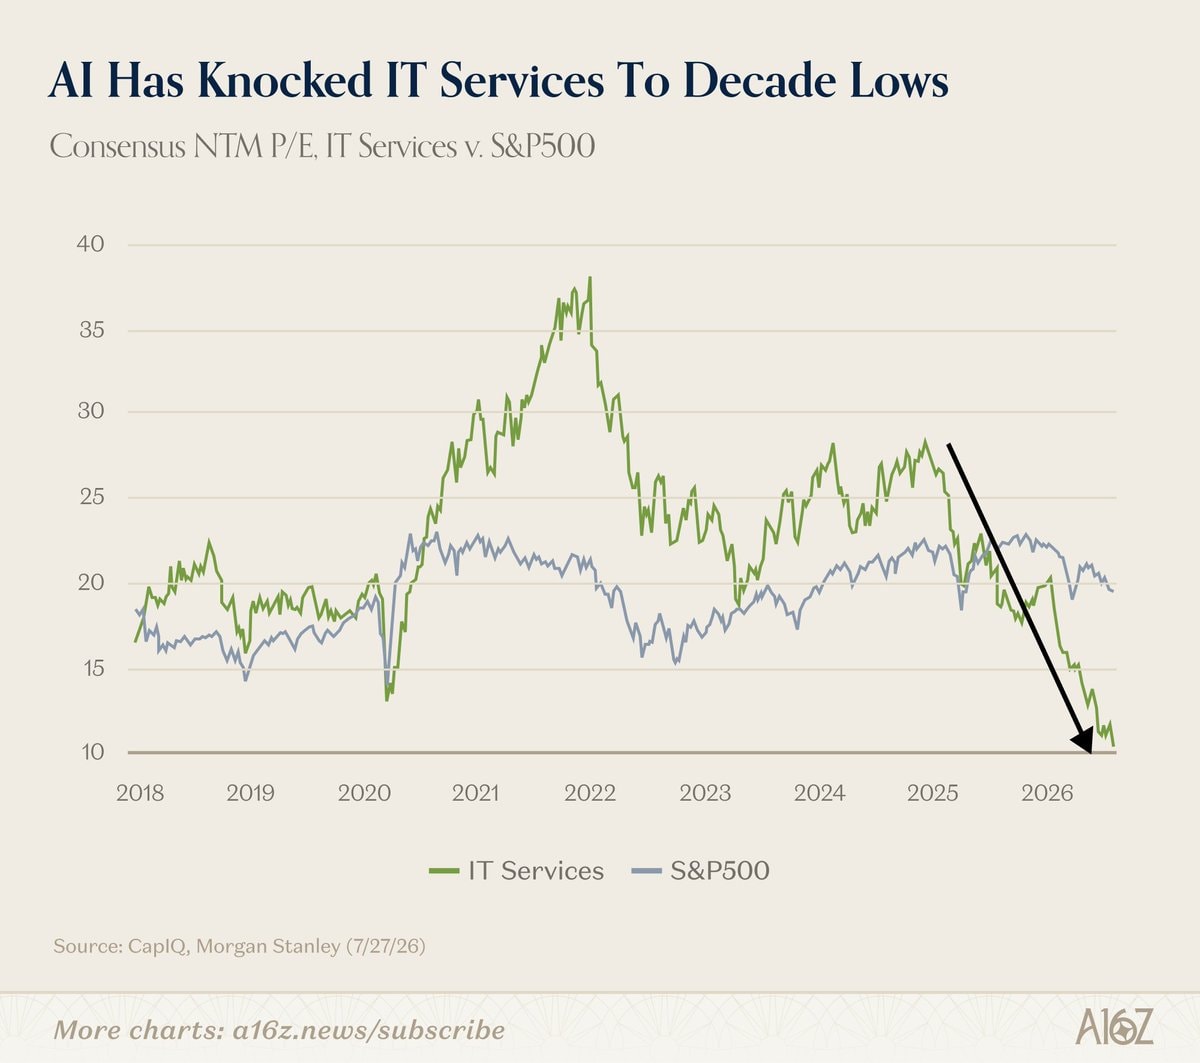
    @eviraThe billable hour was the ultimate safety net for knowledge work, but AI is flipping it into a trap. When drafting, research, and summarizing happen in minutes, clocking hours just screams inefficiency. Charts of the Week shows IT Services hitting decade lows versus the S&P 500, firms stuck on hourly billing will keep getting squeezed, while outcome pricing and productized services actually get rewarded

    원본 게시물 보기

    IT Services vs S&P 500 decade lows

    @evira님의 사진· Aug 9, 2026· Morgan Stanley

    이 사진에 대해

    The image is a financial chart showing the performance of IT Services versus the S&P 500 over time. A downward-sloping black arrow is drawn across the chart, indicating a significant decline. The chart has a clean, professional aesthetic. ON-SCREEN TEXT: AI Has Knocked IT Services To Decade Lows Consensus NTM P/E, IT Services v. S&P500 Source: CapIQ, Morgan Stanley (7/27/26) More charts: a16z.news/subscribe A16Z

    Morgan Stanley 사진 전체 보기Morgan Stanley 위키 읽기

    ?

    아직 댓글이 없습니다. 첫 댓글을 남겨보세요!

    Morgan Stanley 사진 더 보기

    Morgan Stanley 사진 전체 보기
    Morgan Stanley stock market correction call2Morgan Stanley stock market correction callChina STAR 50 falls 40% as AI bubble bursts2China STAR 50 falls 40% as AI bubble burstsAnthropic IPO filing explainedAnthropic IPO filing explainedMorgan Stanley unauthorized AI access4Morgan Stanley unauthorized AI accessSpaceX $600 bull case2SpaceX $600 bull case
    사진
    Evira
    Evira@evira3mo
    🏢Morgan Stanley💭artificial intelligence💭Finance
    IT Services vs S&P 500 decade lows

    @eviraThe billable hour was the ultimate safety net for knowledge work, but AI is flipping it into a trap. When drafting, research, and summarizing happen in minutes, clocking hours just screams inefficiency. Charts of the Week shows IT Services hitting decade lows versus the S&P 500, firms stuck on hourly billing will keep getting squeezed, while outcome pricing and productized services actually get rewarded

    원본 게시물 보기
    IT Services vs S&P 500 decade lows

    @evira님의 사진· Aug 9, 2026· Morgan Stanley

    이 사진에 대해

    The image is a financial chart showing the performance of IT Services versus the S&P 500 over time. A downward-sloping black arrow is drawn across the chart, indicating a significant decline. The chart has a clean, professional aesthetic. ON-SCREEN TEXT: AI Has Knocked IT Services To Decade Lows Consensus NTM P/E, IT Services v. S&P500 Source: CapIQ, Morgan Stanley (7/27/26) More charts: a16z.news/subscribe A16Z

    Morgan Stanley 사진 전체 보기Morgan Stanley 위키 읽기

    ?

    아직 댓글이 없습니다. 첫 댓글을 남겨보세요!

    Morgan Stanley 사진 더 보기

    Morgan Stanley 사진 전체 보기
    Morgan Stanley stock market correction call2Morgan Stanley stock market correction callChina STAR 50 falls 40% as AI bubble bursts2China STAR 50 falls 40% as AI bubble burstsAnthropic IPO filing explainedAnthropic IPO filing explainedMorgan Stanley unauthorized AI access4Morgan Stanley unauthorized AI accessSpaceX $600 bull case2SpaceX $600 bull case